Apache Druid:一款高效的 OLAP 引擎

基本概念

概述

 Apache Druid™ 是目前非常流行的、高性能的、分布式列存储的 OLAP 引擎(准确来说是 MOLAP)。它是一款可以快速(实时)访问大量的、很少变化的数据的系统。并被设计为,在面对代码部署、机器故障和生产系统的其他可能性问题时,依旧能 100% 地正常提供服务

Apache Druid Pumpkin

(图片来源:Vadim Ogievetsky 在万圣节的个人作品,已获得授权)

特性

分析事件流

 Druid 支持对 event-driven 数据进行快速地高并发查询。还可以实时地摄入流式数据,并提供亚秒级查询能力,以支持强大的 UI 交互

创新的架构设计

 Druid 是一种新型数据库,它结合了 OLAP 分析数据库、时间序列数据库 和 全文检索 的思想,以支持流式体系架构下的大部分应用场景

构建事件驱动的数据栈

 Druid 天然集成了消息队列(如 Kafka、AWS Kinesis 等)和数据湖(如 HDFS、AWS S3 等),使得其非常适用于流式总线和流处理器的查询层

解锁新的工作流

 Druid 旨在对实时数据和历史数据进行快速地即时分析。使用可快速更替的查询,进行趋势解释,数据探索,以响应各种分析诉求

多环境部署

 Druid 可以部署在任何的 *NIX 商用硬件上,无论是在云端还是内部部署。Druid 是 Cloud Native 的,这意味着集群扩容和缩容,就像添加和删除进程一样简单

多数据源摄入

 Druid 支持将多种外部数据系统作为数据源,进行数据摄入,包括 HadoopSparkStormKafka

多版本并发控制

 多版本并发控制(MVCCMulti-Version Concurrent Control),主要是为了解决多用户操作同一条记录时的并发问题。MVCC 设计思路是,在并发访问数据库时,不使用粗暴的行锁,而是在事务型操作更新数据时,生成一个新版本的数据。如此,可以保证读写分离,避免了读写操作互相阻塞,以提高并发性能。另外,约束任意时刻只有最新版本的记录是有效的,即也保证了数据的一致性

 而 Druid 中是使用数据更新时间来区分版本,历史节点只加载最新版本的数据。同时,实时数据索引离线数据批量覆盖同时进行的 Lambda 架构设计,既满足了实时响应的需求,又确保了数据的准确性

易于运维

 Druid 集群可以做到 Self-healing 和 Self-balancing。如果 Druid 服务器发生故障,系统将会自动绕过损坏的路由,直到这些机器恢复或被替换掉。在扩缩容集群的时候,只需要增加或下线服务器,集群本身会在后台自动 re-balance。Druid 在设计上保证了可以全天候工作,不会因为任何原因而停机,包括配置更改和集群升级

基础组件

Router 进程

 Router 进程可以在 Broker、Overlord 和 Coordinator 进程之上,提供一层统一的 API 网关。Router 进程本身是可选的,不过如果集群的数据规模已经达到了 TB 级别,还是需要考虑启用的(druid.router.managementProxy.enabled=true)。因为一旦集群规模达到一定的数量级,那么发生故障的概率就会变得不容忽视,而 Router 支持将请求只发送给健康的节点,避免请求失败。同时,查询的响应时间和资源消耗,也会随着数据量的增长而变高,而 Router 支持设置查询的优先级和负载均衡策略,避免了大查询造成的队列堆积或查询热点等问题。另外,Router 节点还可用于将查询路由到不同的 Broker 节点,便于实现冷热分层,以更好地应对超大规模数据集。默认情况下,Router 会根据设置的 Rule 规则,来路由查询请求。例如,如果将最近 1 个月的数据加载到热集群中,则最近一个月内的查询可以路由到一组专用 Broker,超出该时间范围的查询将被路由到另一组 Broker,如此便实现了查询的冷热隔离

Broker 进程

 Broker 进程从客户端接收查询请求,并将这些查询转发给 Historical 和 MiddleManager 进程(通过存储在 ZooKeeper 上的元数据,可以准确地知道 Segment 具体在哪个节点上)。Broker 在接收到这些查询的结果之后,将会合并查询结果并将它们返回给客户端。用户通常会查询 Broker,而不是直接查询 Historical 或 MiddleManager 进程

Overlord 进程

 Overlord 进程监视 MiddleManager 进程,是数据摄入的控制器。负责将数据摄入的任务分配给 MiddleManager 并协调 Segment 的发布,包括接受、拆解、分配 Task,以及创建 Task 相关的锁,并返回 Task 的状态。大致流程如下图所示:

Overlord and MiddleManager with ZooKeeper in Apache Druid

(图片来源:Apache Druid™ 官网)
在很久远的 0.5.29 版本中,Overlord 被称之为 IndexCoordinator

MiddleManager 进程

 MiddleManager 进程负责将新数据摄入到集群中,并发布新的 Segment

 MiddleManager 进程是执行提交的任务的工作节点。MiddleManager 将任务转发给在不同 JVM 中运行的 Peon 进程(如此,可以做到资源和日志的隔离)。MiddleManager、Peon、Task 的对应关系是,每个 Peon 进程一次只能运行一个 Task 任务,但一个 MiddleManager 却可以管理多个 Peon 进程

Coordinator 进程

 Coordinator 进程监视 Historical 节点。Coordinator 负责将 Segment 分配给指定的 Historical 节点,并确保 Segment 在 Historical 节点之间保持负载均衡。另外,Coordinator 还需要加载新的 Segment,以及基于配置的 Rule 来丢弃过时的 Segment

 Coordinator 是周期性运行的(由 druid.coordinator.period 配置指定,默认执行间隔为 60s)。因为需要评估集群的当前状态,才能决定应用哪种策略,所以,Coordinator 需要维护和 ZooKeeper 的连接,以获取集群的信息。而关于 Segment 和 Rule 的信息保存在了元数据库中,所以也需要维护与元数据库的连接

Historical 进程

 Historical 进程是处理存储和查询“历史”数据(包括系统中所有已经存在足够长时间、可以被提交的流式数据)的主要工具(可以理解为,是整个 Druid 集群的支柱)。Historical 进程从 Deep Storage 中下载 Segment,并响应有关这些 Segment 的查询请求(这些请求来自 Broker 进程)。另外,Historical 进程不处理写入请求

 Historical 进程采用了 无共享架构设计(Shared-nothing Architecture),它知道如何去加载和删除 Segment,以及如何基于 Segment 来响应查询。因此,即便底层的 Deep Storage 无法正常工作,Historical 进程还是能针对其已同步的 Segments,正常提供查询服务

核心插件

Kafka Indexing Service

 Kafka Indexing Service 可以在 Overlord 上配置 Supervisor(这里的监管者具体是指 KafkaSupervisor,负责监控单个 DataSource 下的 KafkaIndexTask(Apache Druid 中的 DataSource 可以理解为关系型数据库中的表)。在其构造的时候,可以接受 KafkaSupervisorSpec 以知晓 Kafka 的 Topic 相关的配置信息,以及摄入的规则,用于生成 KafkaIndexTask 索引任务),并负责管理 Kafka 索引任务的创建和生命周期。这些 KIS 任务使用 Kafka 自身的分区和偏移机制来读取事件,因此能够提供 exactly-once 摄取的保证(旧版本下,Tranquility 采用的是 push 的方式,则完全无法实现不丢不重的特性)。KIS 任务还能够从 Kafka 读取非近期事件,并且不受其他摄取机制强加的窗口期限的影响。另外,Supervisor 会监控索引任务的状态,以便管理故障,并保证了可伸缩性和易复制的特性。更多差异点,详见下面的对比表:

Before After
插件 Druid Kafka Eight Kafka Indexing Service
处理流式数据的模式 push pull
Exactly-Once push 模式 + 高级 Kafka API,导致无法实现 pull 模式 + 低级 Kafka API,已实现
乱序数据 超过设定的时间窗口的数据会被丢弃,需通过离线任务补数据 不受时间窗口限制,能够读取非近期的数据
高可用 Realtime 单进程(一旦发生宕机,节点上未提交到 DeepStorage 的数据将全部丢失) MiddleManager 多进程
易用性 每个节点都需要唯一的配置,且 Schema 变更后需滚动重启 统一配置,且无需重启
可见性 实时 非实时
在 0.16.0 版本中,Apache Druid 彻底删除了 Realtime Node 相关的插件,包括了 druid-kafka-eight、druid-kafka-eight-simpleConsumer、druid-rabbitmq 和 druid-rocketmq
虽然新引入的 KIS 有诸多好处,但是世上并不存在“银弹”。因为 KIS 采用了 pull 的方式摄入数据,必然会存在拉取的频率一说。该频率由 offsetFetchPeriod 参数控制,默认 30s 会拉取一次,而最快只能 5s 拉取一次。那为什么不能设置更小的值呢?因为如果过于频繁地向 Kafka 发起请求,可能影响到 Kafka 的稳定性

外部依赖

Metadata Storage

 存储元数据信息,包括 DataSource、Segment 和 Task,以及一些配置信息等。默认使用 Derby,生产环境通常会选择 MySQL 或 PostgreSQL 作为存储媒介

表名 作用
druid_datasource 存储 DataSource,以便 Kafka Index Service 查找
druid_pendingsegments 存储 pending 的 Segments
druid_segments 存储每个 Segment 的 metadata 信息
(表字段:segment_id、datasource、start、end、size、version、partition_num、num_replicas、num_rows、is_active、is_published、is_available、is_realtime、is_overshadowed、shard_spec、dimensions、metrics、last_compaction_state、replication_factor)
druid_rules 关于 Segment 的 load / drop 规则
druid_config 存放运行时配置信息
druid_tasks 为 Indexing Service 保存 Task 信息
druid_tasklogs 为 Indexing Service 保存 Task 日志
druid_tasklocks 为 Indexing Service 保存 Task 锁
上面三张表,都是 Overlord 用来存放索引 Task 的数据,防止 Overlord 挂掉,而导致 Task 丢失
druid_supervisors 为 Indexing Service 保存 Supervisor 信息
druid_audit 记录配置、Coordinator 规则的变化
在 0.16.0 版本中,Apache Druid 从 druid_segments 表中删除了无用的 is_realtime 字段
在 0.19.0 版本中,Apache Druid 为了解决反序列化 payload 带来的性能问题,将 druid_segments 表中的 payload 字段,拆解成 dimensions、metrics 和 shardSpec 三个字段
在 27.0.0 版本中,Apache Druid 为了支持查询 Deep Storage 功能,往 druid_segments 表中增加了 replication_factor 新字段,用来记录 Segment 是否没有被任何 Historical 节点加载,以便直接去 Deep Storage 进行查询
在 28.0.0 版本中,Apache Druid 为了支持回收站功能,往 druid_segments 表中增加了 used_status_last_updated 新字段,用来记录 Segment 被标记为 unused 状态的时刻,避免数据被立刻物理删除

Deep Storage

 Deep Storage 作为每个 Druid Server 都可以访问的共享文件存储。通常是像 HDFSAliyunOSSS3 这样的分布式对象存储,或者是网络文件系统(NFS)。Druid 使用它来存储已被摄入系统的任何数据

 Druid 仅将 Deep Storage 用作数据的备份,并将其作为在 Druid 进程间在后台传输数据的一种方式。当接受到查询请求,Historical 进程不会从 Deep Storage 读取数据,而是在响应任何查询之前,读取从本地磁盘 pre-fetched 的 Segments。这意味着 Druid 在查询期间永远不需要访问 Deep Storage,从而极大地降低了查询延迟。这也意味着,必须保证 Deep Storage 和 Historical 进程所在节点,能拥有足够的磁盘空间

ZooKeeper

 用于管理集群的当前状态,并涵盖了以下几个主要特性:

  • Coordinator 节点的 Leader 选举
  • Historical 节点发布 Segment 的协议
  • Coordinator 和 Historical 之间 load / drop Segment 的协议
  • Overlord 节点的 Leader 选举
  • Overlord 和 MiddleManager 之间的 Task 管理
选举是通过 Apache Curator 框架中的 LeaderLatch 来完成的,具体的实现细节详见 CuratorDruidLeaderSelector 类

数据结构

Apache Druid Data Structure

(使用 Keynote™ 绘制而成)

时间序列

 时间序列(Timestamp),本身 Druid 是时间序列数据库,Druid 中所有查询以及索引过程都和时间维度有关。Druid 底层使用绝对毫秒数保存时间戳,默认使用 ISO-8601 格式展示时间:yyyy-MM-ddThh:mm:sss.SSSZ

维度列

 维度列(Dimensions),Druid 的维度概念和广义的 OLAP 定义一致,一条记录中的字符、数值、多值等类型的数据均可看作是维度列。维度列可用于过滤筛选(filter)、分组(group)数据

度量列

 度量列(Metrics),Druid 的度量概念也与广义的 OLAP 定义一致,一条记录中的数值(Numeric)类型数据可看作是度量列,度量列被用于聚合(aggregation)和计算(computation)操作

从这里可以看出来,Apache Druid 是天然支持多值数据模型的

部署

单机版

下载

1
$ wget https://mirrors.tuna.tsinghua.edu.cn/apache/druid/28.0.1/apache-druid-28.0.1-bin.tar.gz

解压

1
$ tar zxvf apache-druid-28.0.1-bin.tar.gz

启动

1
2
$ cd apache-druid-28.0.1
$ bin/start-micro-quickstart
通过 examples/conf/druid/single-server/micro-quickstart 下的配置项,可以计算得出 1C2G 的机器规格,便可以启动一个完整的 Apache Druid 服务

可视化

 浏览器中打开 localhost:8888 地址,控制台的界面如下图所示:

Apache Druid Web Console

(对 Web Console 可视化页面的截图)

Docker 容器版

下载

1
2
3
4
5
6
7
8
# 搜索 Docker Hub
$ docker search druid

# 下载最新版本的镜像
$ docker pull apache/druid:28.0.1

# 检查镜像是否下载成功
$ docker image list

配置 Docker 文件共享

 打开配置面板,进入 File Sharing 配置页面,增加 ${the path of your source code}/distribution/docker/storage 路径,随后点击 Apply & Restart 按钮,应用并重启

启动

1
2
3
4
5
6
7
8
9
10
$ git clone https://github.com/apache/druid.git
$ cd druid
$ docker-compose -f distribution/docker/docker-compose.yml up

# 同理,也可以使用 start/stop 命令启停容器
$ docker-compose -f distribution/docker/docker-compose.yml stop
$ docker-compose -f distribution/docker/docker-compose.yml start

# 或者使用 down 命令移除容器
$ docker-compose -f distribution/docker/docker-compose.yml down

校验

Historical 容器
1
2
$ docker exec -it historical sh
$ ls /opt/data/
1
indexing-logs  segments
1
$ ls /opt/data/segments/
1
intermediate_pushes  wikipedia
1
$ ls /opt/data/segments/wikipedia/
1
2016-06-27T00:00:00.000Z_2016-06-28T00:00:00.000Z
1
$ ls /opt/data/segments/wikipedia/2016-06-27T00\:00\:00.000Z_2016-06-28T00\:00\:00.000Z/
1
2020-06-04T07:11:42.714Z
1
$ ls /opt/data/segments/wikipedia/2016-06-27T00\:00\:00.000Z_2016-06-28T00\:00\:00.000Z/2020-06-04T07\:11\:42.714Z/0/
1
index.zip
1
$ ls -lh
1
2
3
4
5
6
total 8M
-rw-r--r-- 1 druid druid 5.9M Jun 4 07:49 00000.smoosh
-rw-r--r-- 1 druid druid 29 Jun 4 07:49 factory.json
-rw-r--r-- 1 druid druid 1.7M Jun 4 07:14 index.zip
-rw-r--r-- 1 druid druid 707 Jun 4 07:49 meta.smoosh
-rw-r--r-- 1 druid druid 4 Jun 4 07:49 version.bin
1
$ cat factory.json
1
{"type":"mMapSegmentFactory"}
1
$ xxd version.bin
1
00000000: 0000 0009                                ....
1
$ cat meta.smoosh
1
2
3
4
5
6
7
8
9
10
11
12
13
14
15
16
17
18
19
20
21
22
23
24
25
26
27
v1,2147483647,1
__time,0,0,1106
channel,0,145739,153122
cityName,0,153122,195592
comment,0,195592,1598156
count,0,1106,2063
countryIsoCode,0,1598156,1614170
countryName,0,1614170,1630859
diffUrl,0,1630859,4224103
flags,0,4224103,4252873
index.drd,0,6162513,6163275
isAnonymous,0,4252873,4262876
isMinor,0,4262876,4282592
isNew,0,4282592,4290896
isRobot,0,4290896,4298796
isUnpatrolled,0,4298796,4307345
metadata.drd,0,6163275,6163925
namespace,0,4307345,4342089
page,0,4342089,5710071
regionIsoCode,0,5710071,5730339
regionName,0,5730339,5759351
sum_added,0,2063,37356
sum_commentLength,0,37356,66244
sum_deleted,0,66244,81170
sum_delta,0,81170,126275
sum_deltaBucket,0,126275,145739
user,0,5759351,6162513
其中,index.drd 包含该 Segment 覆盖的时间范围、指定的 Bitmap 种类(concise / roaring),以及包含的列和维度;而 metadata.drd 包含是否 Rollup、哪些聚合函数、查询的粒度,时间戳字段信息,以及可用于存储任意 Key-Value 数据的 Map 结构(例如 Kafka Firehose 用来存储 offset 信息)。更多细节,详见 org.apache.druid.segment.IndexIO.V9IndexLoader#load
PostgreSQL 容器
1
2
$ docker exec -it postgres bash
$ psql --version
1
psql (PostgreSQL) 11.7
1
2
# 回车之后输入 druid 用户的密码
$ psql -U druid -d druid
1
2
-- 列出所有的 database
> \l
1
2
3
4
5
6
7
8
9
10
                             List of databases
Name | Owner | Encoding | Collate | Ctype | Access privileges
-----------+-------+----------+------------+------------+-------------------
druid | druid | UTF8 | en_US.utf8 | en_US.utf8 |
postgres | druid | UTF8 | en_US.utf8 | en_US.utf8 |
template0 | druid | UTF8 | en_US.utf8 | en_US.utf8 | =c/druid +
| | | | | druid=CTc/druid
template1 | druid | UTF8 | en_US.utf8 | en_US.utf8 | =c/druid +
| | | | | druid=CTc/druid
(4 rows)
1
2
-- 连接 druid 这个 database
> \c druid
1
You are now connected to database "druid" as user "druid".
1
2
-- 列出所有的表
> \dt
1
2
3
4
5
6
7
8
9
10
11
12
13
14
               List of relations
Schema | Name | Type | Owner
--------+-----------------------+-------+-------
public | druid_audit | table | druid
public | druid_config | table | druid
public | druid_datasource | table | druid
public | druid_pendingsegments | table | druid
public | druid_rules | table | druid
public | druid_segments | table | druid
public | druid_supervisors | table | druid
public | druid_tasklocks | table | druid
public | druid_tasklogs | table | druid
public | druid_tasks | table | druid
(10 rows)
1
2
-- 查看 druid_segments 表结构
> \d+ druid_segments;
1
2
3
4
5
6
7
8
9
10
11
12
13
14
15
16
                                         Table "public.druid_segments"
Column | Type | Collation | Nullable | Default | Storage | Stats target | Description
--------------+------------------------+-----------+----------+---------+----------+--------------+-------------
id | character varying(255) | | not null | | extended | |
datasource | character varying(255) | | not null | | extended | |
created_date | character varying(255) | | not null | | extended | |
start | character varying(255) | | not null | | extended | |
end | character varying(255) | | not null | | extended | |
partitioned | boolean | | not null | | plain | |
version | character varying(255) | | not null | | extended | |
used | boolean | | not null | | plain | |
payload | bytea | | not null | | extended | |
Indexes:
"druid_segments_pkey" PRIMARY KEY, btree (id)
"idx_druid_segments_datasource_used_end_start" btree (datasource, used, "end", start)
"idx_druid_segments_used" btree (used)
1
2
-- 查看 segment 的元数据
> select id, datasource, created_date, start, "end", partitioned, version, used from public.druid_segments;
1
wikipedia_2016-06-27T00:00:00.000Z_2016-06-28T00:00:00.000Z_2020-06-04T07:11:42.714Z | wikipedia  | 2020-06-04T07:14:50.619Z | 2016-06-27T00:00:00.000Z | 2016-06-28T00:00:00.000Z | t           | 2020-06-04T07:11:42.714Z | t
1
2
-- 查看 task 的 payload 配置
> select convert_from(payload, 'UTF8')::json from druid_tasks;
1
2
-- 查看 druid 用户的权限
> select rolname, rolsuper, rolcreaterole, rolcreatedb, rolcanlogin, rolreplication from pg_roles where rolname = 'druid';
1
2
3
4
 rolname | rolsuper | rolcreaterole | rolcreatedb | rolcanlogin | rolreplication 
---------+----------+---------------+-------------+-------------+----------------
druid | f | f | t | t | f
(1 row)

Kubernetes 集群版

安装

1
2
$ helm repo add druid-helm https://asdf2014.github.io/druid-helm/
$ helm install my-druid druid-helm/druid --version 29.0.4
1
2
3
4
5
6
7
8
9
10
11
NAME: druid-1592218780
LAST DEPLOYED: Mon Jun 15 23:59:42 2020
NAMESPACE: default
STATUS: deployed
REVISION: 1
TEST SUITE: None
NOTES:
1. Get the router URL by running these commands:
export POD_NAME=$(kubectl get pods --namespace default -l "app=druid,release=druid-1592218780" -o jsonpath="{.items[0].metadata.name}")
echo "Visit http://127.0.0.1:8080 to use your application"
kubectl port-forward $POD_NAME 8080:8888
1
2
$ export POD_NAME=$(kubectl get pods --namespace default -l "app=druid,release=`helm list | grep druid- | awk '{print $1}'`" | grep router | awk '{print $1}')
$ nohup kubectl port-forward $POD_NAME 8888:8888 --address 0.0.0.0 2>&1 &

校验

1
$ kubectl get all
1
2
3
4
5
6
7
8
9
10
11
12
13
14
15
16
17
18
19
20
21
22
23
24
25
26
27
28
29
30
31
32
33
34
35
36
37
38
39
40
41
42
43
44
45
46
NAME                                                READY   STATUS    RESTARTS   AGE
pod/druid-1592364086-broker-76bf68c8bc-96d56 1/1 Running 0 2m36s
pod/druid-1592364086-coordinator-5f645bd5c8-rhhpz 1/1 Running 0 2m36s
pod/druid-1592364086-historical-0 1/1 Running 0 2m36s
pod/druid-1592364086-middle-manager-0 1/1 Running 0 2m36s
pod/druid-1592364086-postgresql-0 1/1 Running 0 2m36s
pod/druid-1592364086-router-67f678b6c5-mw6b4 1/1 Running 0 2m36s
pod/druid-1592364086-zookeeper-0 1/1 Running 0 2m36s
pod/druid-1592364086-zookeeper-1 1/1 Running 0 2m8s
pod/druid-1592364086-zookeeper-2 1/1 Running 0 85s
pod/local-volume-provisioner-8sjtx 1/1 Running 0 8m59s
pod/local-volume-provisioner-9z7mh 1/1 Running 0 8m59s
pod/local-volume-provisioner-m2xrt 1/1 Running 0 8m59s
pod/local-volume-provisioner-ptbqs 1/1 Running 0 8m59s
pod/local-volume-provisioner-tw2fn 1/1 Running 0 8m59s

NAME TYPE CLUSTER-IP EXTERNAL-IP PORT(S) AGE
service/druid-1592364086-broker ClusterIP 10.10.10.128 <none> 8082/TCP 2m36s
service/druid-1592364086-coordinator ClusterIP 10.10.10.195 <none> 8081/TCP 2m36s
service/druid-1592364086-historical ClusterIP 10.10.10.226 <none> 8083/TCP 2m36s
service/druid-1592364086-middle-manager ClusterIP 10.10.10.108 <none> 8091/TCP 2m36s
service/druid-1592364086-postgresql ClusterIP 10.10.10.155 <none> 5432/TCP 2m36s
service/druid-1592364086-postgresql-headless ClusterIP None <none> 5432/TCP 2m36s
service/druid-1592364086-router ClusterIP 10.10.10.29 <none> 8888/TCP 2m36s
service/druid-1592364086-zookeeper ClusterIP 10.10.10.122 <none> 2181/TCP 2m36s
service/druid-1592364086-zookeeper-headless ClusterIP None <none> 2181/TCP,3888/TCP,2888/TCP 2m36s
service/kubernetes ClusterIP 10.10.10.1 <none> 443/TCP 30m

NAME DESIRED CURRENT READY UP-TO-DATE AVAILABLE NODE SELECTOR AGE
daemonset.apps/local-volume-provisioner 5 5 5 5 5 <none> 9m

NAME READY UP-TO-DATE AVAILABLE AGE
deployment.apps/druid-1592364086-broker 1/1 1 1 2m36s
deployment.apps/druid-1592364086-coordinator 1/1 1 1 2m36s
deployment.apps/druid-1592364086-router 1/1 1 1 2m36s

NAME DESIRED CURRENT READY AGE
replicaset.apps/druid-1592364086-broker-76bf68c8bc 1 1 1 2m36s
replicaset.apps/druid-1592364086-coordinator-5f645bd5c8 1 1 1 2m36s
replicaset.apps/druid-1592364086-router-67f678b6c5 1 1 1 2m36s

NAME READY AGE
statefulset.apps/druid-1592364086-historical 1/1 2m36s
statefulset.apps/druid-1592364086-middle-manager 1/1 2m36s
statefulset.apps/druid-1592364086-postgresql 1/1 2m36s
statefulset.apps/druid-1592364086-zookeeper 3/3 2m36s
上述 CLUSTER-IP 信息已脱敏

ZooKeeper 元数据

1
2
$ zkCli.sh
[zk: localhost:2181(CONNECTED) 0] ls -R /druid
1
2
3
4
5
6
7
8
9
10
11
12
13
14
15
16
17
18
19
20
21
22
23
24
25
26
27
28
29
30
31
32
33
34
35
36
37
38
39
40
41
42
43
44
45
46
47
48
49
50
51
52
53
54
55
56
57
58
59
60
61
62
/druid

/druid/announcements
/druid/coordinator
/druid/discovery
/druid/indexer
/druid/internal-discovery
/druid/loadQueue
/druid/overlord
/druid/segments
/druid/servedSegments

/druid/announcements/10.10.10.63:8083

/druid/coordinator/_COORDINATOR
/druid/coordinator/_COORDINATOR/_c_281fb87b-c40c-4d71-a657-8254cbcf3730-latch-0000000000

/druid/discovery/druid:broker
/druid/discovery/druid:coordinator
/druid/discovery/druid:overlord
/druid/discovery/druid:router

/druid/discovery/druid:broker/0e76bfc1-87f8-4799-9c36-0fb0e5617aef
/druid/discovery/druid:coordinator/035b1ada-531e-4a71-865b-7a1a6d6f1734
/druid/discovery/druid:overlord/a74523d6-1708-45b3-9c0b-87f438cda4e3
/druid/discovery/druid:router/c0bb18d3-51b1-4089-932b-a5d6e05ab91c

/druid/indexer/announcements
/druid/indexer/status
/druid/indexer/tasks

/druid/indexer/announcements/10.10.10.65:8091
/druid/indexer/status/10.10.10.65:8091
/druid/indexer/tasks/10.10.10.65:8091

/druid/internal-discovery/BROKER
/druid/internal-discovery/COORDINATOR
/druid/internal-discovery/HISTORICAL
/druid/internal-discovery/INDEXER
/druid/internal-discovery/MIDDLE_MANAGER
/druid/internal-discovery/OVERLORD
/druid/internal-discovery/PEON
/druid/internal-discovery/ROUTER

/druid/internal-discovery/BROKER/10.10.10.73:8082
/druid/internal-discovery/COORDINATOR/10.10.10.72:8081
/druid/internal-discovery/HISTORICAL/10.10.10.63:8083
/druid/internal-discovery/MIDDLE_MANAGER/10.10.10.65:8091
/druid/internal-discovery/OVERLORD/10.10.10.72:8081
/druid/internal-discovery/ROUTER/10.10.10.55:8888

/druid/loadQueue/10.10.10.63:8083

/druid/overlord/_OVERLORD
/druid/overlord/_OVERLORD/_c_ecacbc56-4d36-4ca0-ac1d-0df919c40bff-latch-0000000000

/druid/segments/10.10.10.63:8083

/druid/segments/10.10.10.63:8083/10.10.10.63:8083_historical__default_tier_2020-06-20T04:08:23.309Z_1b957acb6850491ca6ea885fca1b3c210
/druid/segments/10.10.10.63:8083/10.10.10.63:8083_historical__default_tier_2020-06-20T04:10:16.643Z_57c1f60104a94c459bf0331eb3c1f0a01

/druid/servedSegments/10.10.10.63:8083
上述 IP 地址相关信息已脱敏

Broker 健康检查

1
2
$ kill `ps -ef | grep 8082 | grep -v grep | awk '{print $2}'`; export POD_NAME=$(kubectl get pods --namespace default -l "app=druid,release=`helm list | grep druid- | awk '{print $1}'`" | grep broker | awk '{print $1}') ; nohup kubectl port-forward $POD_NAME 8082:8082 --address 0.0.0.0 2>&1 &
$ curl localhost:8082/status/health
1
true

MiddleManager 任务

1
2
3
$ kubectl exec -it druid-1593317208-middle-manager-0 sh
$ cd /opt/druid/var/druid/task
$ find
1
2
3
4
5
.
./workerTaskManagerTmp
./completedTasks
./restore.json
./assignedTasks
1
$ cat restore.json
1
{"runningTasks":[]}
MiddleManager 会将运行中的任务 ID(TaskRunnerWorkItem#taskId)的列表持久化在本地 restore.json 文件中,以便重启节点的时候恢复正在运行中的任务

Historical 缓存

1
2
$ cd /opt/druid/var/druid/segment-cache/info_dir
$ cat wikipedia_2016-06-27T00:00:00.000Z_2016-06-27T01:00:00.000Z_2020-06-20T04:10:01.833Z
1
2
3
4
5
6
7
8
9
10
11
12
13
14
15
16
17
18
19
{
"dataSource": "wikipedia",
"interval": "2016-06-27T00:00:00.000Z/2016-06-27T01:00:00.000Z",
"version": "2020-06-20T04:10:01.833Z",
"loadSpec": {
"type": "hdfs",
"path": "hdfs://10.10.10.44:8020/druid/segments/wikipedia/20160627T000000.000Z_20160627T010000.000Z/2020-06-20T04_10_01.833Z/0_index.zip"
},
"dimensions": "channel,cityName,comment,countryIsoCode,countryName,diffUrl,flags,isAnonymous,isMinor,isNew,isRobot,isUnpatrolled,namespace,page,regionIsoCode,regionName,user",
"metrics": "count,sum_added,sum_commentLength,sum_deleted,sum_delta,sum_deltaBucket",
"shardSpec": {
"type": "numbered",
"partitionNum": 0,
"partitions": 0
},
"binaryVersion": 9,
"size": 241189,
"identifier": "wikipedia_2016-06-27T00:00:00.000Z_2016-06-27T01:00:00.000Z_2020-06-20T04:10:01.833Z"
}
上述 JSON 已格式化,以便于阅读
1
2
$ cd /opt/druid/var/druid/segment-cache/wikipedia/2016-06-27T00:00:00.000Z_2016-06-27T01:00:00.000Z/2020-06-20T04:10:01.833Z/0
$ ls
1
00000.smoosh  factory.json  meta.smoosh  version.bin

Segment 文件

1
2
3
4
5
6
$ kubectl exec -it hdfs-1593317115-namenode-0 bash
$ hdfs dfs -get /druid/segments/wikipedia/20160627T000000.000Z_20160627T010000.000Z/2020-06-28T04_10_01.833Z/0_index.zip /tmp/index/
$ exit
$ kubectl cp hdfs-1593317115-namenode-0:/tmp/index/0_index.zip /tmp/0_index.zip
$ unzip 0_index.zip
$ ls
1
00000.smoosh  0_index.zip  factory.json  meta.smoosh  version.bin

Coordinator 动态配置

1
2
$ kill `ps -ef | grep 8081 | grep -v grep | awk '{print $2}'`; export POD_NAME=$(kubectl get pods --namespace default -l "app=druid,release=`helm list | grep druid- | awk '{print $1}'`" | grep coordinator | awk '{print $1}') ; nohup kubectl port-forward $POD_NAME 8081:8081 --address 0.0.0.0 2>&1 &
$ curl localhost:8081/druid/coordinator/v1/config | python -m json.tool
1
2
3
4
5
6
7
8
9
10
11
12
13
14
15
16
17
{
"balancerComputeThreads": 1,
"decommissioningMaxPercentOfMaxSegmentsToMove": 70,
"decommissioningNodes": [],
"emitBalancingStats": false,
"killAllDataSources": false,
"killDataSourceWhitelist": [],
"killPendingSegmentsSkipList": [],
"maxSegmentsInNodeLoadingQueue": 0,
"maxSegmentsToMove": 5,
"mergeBytesLimit": 524288000,
"mergeSegmentsLimit": 100,
"millisToWaitBeforeDeleting": 900000,
"pauseCoordination": false,
"replicantLifetime": 15,
"replicationThrottleLimit": 10
}
1
2
3
# 将 maxSegmentsToMove 调整为 50
$ curl -XPOST -H 'Content-Type:application/json' localhost:8081/druid/coordinator/v1/config -d '{"maxSegmentsToMove":50}'
$ curl localhost:8081/druid/coordinator/v1/config | python -m json.tool
1
2
3
4
5
6
7
8
9
10
11
12
13
14
15
16
17
{
"balancerComputeThreads": 1,
"decommissioningMaxPercentOfMaxSegmentsToMove": 70,
"decommissioningNodes": [],
"emitBalancingStats": false,
"killAllDataSources": false,
"killDataSourceWhitelist": [],
"killPendingSegmentsSkipList": [],
"maxSegmentsInNodeLoadingQueue": 0,
"maxSegmentsToMove": 50,
"mergeBytesLimit": 524288000,
"mergeSegmentsLimit": 100,
"millisToWaitBeforeDeleting": 900000,
"pauseCoordination": false,
"replicantLifetime": 15,
"replicationThrottleLimit": 10
}
动态配置项 maxSegmentsToMove 可以用于控制同时被 rebalance 的 Segment 数量
动态配置项 replicantLifetime 可以用于控制 Historical 上 Segment 存活的时间。当 Historical 下线时,其上的 Segment 会被认为已经失效,然后 Coordinator 会通知其他 Historical 来加载这些 Segment。但是在 Historical 升级做滚动重启的时候,如果立即使这些 Segment 失效,会导致严重的数据漂移。因此,需要给这些 Segment 增加一个 lifetime 机制,以规避此类情况

Druid SQL 查询

1
2
3
4
# 映射 Broker 容器的 8082 端口
$ kill `ps -ef | grep 8082 | grep -v grep | awk '{print $2}'`; export POD_NAME=$(kubectl get pods --namespace default -l "app=druid,release=`helm list | grep druid- | awk '{print $1}'`" | grep broker | awk '{print $1}') ; nohup kubectl port-forward $POD_NAME 8082:8082 --address 0.0.0.0 2>&1 &
$ echo '{"query":"SELECT COUNT(*) as res FROM wikipedia"}' > druid_query.sql
$ curl -XPOST -H'Content-Type: application/json' http://localhost:8082/druid/v2/sql/ -d@druid_query.sql
1
[{"res":24433}]

配置

常用端口

端口描述 端口号
Router, if used 8088
Broker 8082
Overlord 8090
MiddleManager; you may need higher than port 8199 if you have a very high druid.worker.capacity 8091, 8100 ~ 8199
Coordinator 8081
Historical 8083
Derby on your Coordinator; not needed if you are using a separate metadata store like MySQL or PostgreSQL 1527
ZooKeeper; not needed if you are using a separate ZooKeeper cluster 2181
在生产环境中,建议将 ZooKeeper 和 Metadata Stroage 部署在独立的物理机上,而不是混合部署在 Coordinator 节点上

rollup

 在 Apache Druid 0.9.2 版本之后,我们可以通过在 granularitySpec 中配置 "rollup": false,来完全关闭 RollUp 特性,即在数据摄入的过程中,不做任何的预聚合,只保留最原始的数据点。即便是同一时刻的、具有相同维度的、完全相同的多个数据点,都会全部存储下来,不会发生覆盖写

selectStrategy

 该参数默认为 fillCapacity,意味着分配 Task 的时候,会将某个 MiddleManager 分配满,才会分配新的 Task 到其他 MiddleManager 上。这里可以考虑使用 equalDistribution 策略,将 Task 均匀分配到 MiddleManager 上

1
2
$ cd $DRUID_HOME
$ vim conf/druid/overlord/runtime.properties
1
druid.indexer.selectStrategy=equalDistribution
在 0.11.0 版本中,默认策略已经改成了 equalDistribution。详见 WorkerBehaviorConfig#DEFAULT_STRATEGY

maxRowsPerSegment

 该参数用于控制每个 Segment 中最大能够存储的记录行数(默认值为 500,0000),只有二级分区采用的是 dynamic 才会生效。如果 spec.tuningConfig.type 设置的是 hashed,则需要指定 shard 的数量,以及哪些 Dimension 被用于 hash 计算(默认为所有 Dimension)。另外,在 dynamic 类型的二级分区中,还有一个 maxTotalRows 参数(默认值为 2000,0000),用来控制所有尚未被存储到 Deep Storage 中的 segment 的记录行数,一旦达到 maxTotalRows 则会立即触发 push 操作

如果该参数设置得很低,会产生很多小的 Segment 文件。一方面,如果 DeepStorage 为 HDFS 的话,会触发小文件问题,影响到集群性能(访问大量小文件不同于访问少数大文件,需要不断地在 DataNode 之间跳转,大部分时间都会耗费在 task 的启动和释放上,并且 NameNode 要监控的数据块变多后,网络带宽和内存占用也会比高,还会拖慢 NameNode 节点的故障恢复);另一方面,如果操作系统中 vm.max_map_count 参数为默认的 65530 的话,可能会达到这个阈值,使得 MMap 操作失败,进而导致 Historical 进程 crash 退出,如果 Segment 一直无法完成 handoff 的过程,则会促使 Coordinator 进程 kill 实时任务

druid.server.tier

 该参数相当于给 Historical 节点加了一个标签,可以将相同 Tier 名称的 Historical 进行分组,便于实现冷热分层。在 historical/runtime.properties 配置文件中设置,默认值为 _default_tier。例如,可以创建 hotcold 两个 Tier,hot Tier 用于存储最近三个月的数据,cold Tier 用于存储最近一年的数据。如此一来,因为 cold 分组下的 Historical 节点存储的数据只需要应对一些低频查询,便可以使用非 SSD 的磁盘,以节约硬件成本

tieredReplicants

 该参数用于在 Rule 中设置 Tier 存储的副本数量。假设将 tieredReplicants 设置为 2 之后,数据便会在不同的 Historical 节点上各自存储一份,以避免某一个 Historical 故障,而影响到查询

Coordinator Rule 配置

保留最近 30 天数据

Apache Druid Coordinator UI

(对 Coordinator 可视化页面的截图)

查询

Druid SQL

语法规则

1
2
3
4
5
6
7
8
9
10
11
[ EXPLAIN PLAN FOR ]
[ WITH tableName [ ( column1, column2, ... ) ] AS ( query ) ]
SELECT [ ALL | DISTINCT ] { * | exprs }
FROM { <table> | (<subquery>) | <o1> [ INNER | LEFT ] JOIN <o2> ON condition }
[ WHERE expr ]
[ GROUP BY [ exprs | GROUPING SETS ( (exprs), ... ) | ROLLUP (exprs) | CUBE (exprs) ] ]
[ HAVING expr ]
[ ORDER BY expr [ ASC | DESC ], expr [ ASC | DESC ], ... ]
[ LIMIT limit ]
[ OFFSET offset ]
[ UNION ALL <another query> ]
Apache Druid 在 0.20.0 版本中,支持了 OFFSET 关键字,可以配合 LIMIT 实现分页查询的功能

查询示例

1
2
3
SELECT "__time", "channel", "cityName", "comment", "count", "countryIsoCode", "countryName", "diffUrl", "flags", "isAnonymous", "isMinor", "isNew", "isRobot", "isUnpatrolled", "namespace", "page", "regionIsoCode", "regionName", "sum_added", "sum_commentLength", "sum_deleted", "sum_delta", "sum_deltaBucket", "user"
FROM "wikipedia"
WHERE "__time" >= CURRENT_TIMESTAMP - INTERVAL '1' DAY

RESTful API

Shell

普通 Select 查询
1
$ curl -X POST -H 'Content-Type: application/json' -u xxx:yyy http://localhost:8082/druid/v2/sql -d '{"query":"SELECT * FROM wikipedia ORDER BY __time DESC LIMIT 1"}' | jq
获取所有 DataSource
1
$ curl http://localhost:8082/druid/v2/datasources
1
["inline_data","wikipedia"]
聚合查询
1
$ vim query.body
1
2
3
4
5
6
7
8
9
10
11
12
13
14
15
16
17
18
19
20
21
22
23
24
25
26
27
28
29
30
31
32
33
34
35
36
37
38
39
40
41
{
"dimensions": [
"dimensions1",
"dimensions2"
],
"aggregations": [
{
"filter": {
"type": "selector",
"dimension": "metric",
"value": "metrics01"
},
"aggregator": {
"type": "doubleSum",
"fieldName": "sum",
"name": "metric01"
},
"type": "filtered"
}
],
"filter": {
"type": "selector",
"dimension": "level",
"value": "day"
},
"intervals": "2017-02-09T15:03:12+08:00/2017-02-09T16:03:12+08:00",
"limitSpec": {
"limit": 10,
"type": "default",
"columns": [
{
"direction": "descending",
"dimension": "metric01"
}
]
},
"granularity": "all",
"postAggregations": [],
"queryType": "groupBy",
"dataSource": "yuzhouwan_metrics"
}
1
$ curl -X POST "http://localhost:8082/druid/v2/?pretty" -H 'content-type: application/json' -d @query.body
在 postAggregations 中里面是串行执行的,并可以传递计算结果

Python

1
2
3
4
5
6
7
8
9
10
11
12
13
14
15
16
17
18
19
20
21
22
23
24
25
26
27
28
import requests


def query_druid(url, headers, auth, sql, limit):
body = {
"query": sql,
"resultFormat": "array",
"header": 'true',
"context": {
"sqlOuterLimit": limit
}
}
return requests.post(url, headers=headers, auth=auth, json=body).json()


ip = 'localhost:8082'
url_ = 'http://%s/druid/v2/sql' % ip
headers_ = {'Content-Type': 'application/json'}
auth_ = ("xxx", "yyy")
sql_ = """
SELECT *
FROM wikipedia
ORDER BY __time DESC
LIMIT 1
"""
wikipedia = query_druid(url_, headers_, auth_, sql_, 1)
print("column:", wikipedia[0])
print("record:", wikipedia[1])

Apache Calcite

Maven 依赖

1
2
3
4
5
<dependency>
<groupId>org.apache.calcite</groupId>
<artifactId>calcite-druid</artifactId>
<version>1.34.0</version>
</dependency>

Java 实现

1
2
3
4
5
6
7
8
9
10
String url = "jdbc:avatica:remote:url=http://localhost:8082/druid/v2/sql/avatica/";
String query = "SELECT COUNT(*) as res FROM wikipedia";
try (Connection connection = DriverManager.getConnection(url)) {
try (Statement statement = connection.createStatement();
ResultSet resultSet = statement.executeQuery(query)) {
while (resultSet.next()) {
System.out.println(resultSet.getInt(1));
}
}
}
1
24433
Apache Calcite 的 Druid adapter 持续完善查询算子下推,已支持 count(*) 聚合、filter 过滤和 groupby 分组等

Druid Client

 一旦有了 Client 之后,我们就可以做很多事情,比如流控、权限管理、统一 SQL 层等(社区正在 !5006 中讨论,欢迎加入)。目前,社区已经有针对 JavaPythonGolangScalaClojurePHPR 语言,实现了对应的 Client 工具

Presto

 PrestoDB 和 PrestoSQL 均支持 Druid Connector。具体的使用方式,详见我的另一篇博客:Presto:分布式 SQL 查询引擎

InfluxDB Line Protocol Parser

 Apache Druid 通过 druid-influx-extensions 插件支持解析 InfluxDB 写入协议。更多关于 InfluxDB 的介绍,详见:开源时序数据库 InfluxDB

PlyQL

目前 PlyQL 已经停止维护,建议优先使用上文介绍的几种交互方式

基本用法

 通过 --host-q 分别指定 Broker 地址查询语句

1
2
$ cd /home/druid/software/imply-1.3.0
$ bin/plyql --host <broker host>:8082 -q "show tables" # --host <broker>:<port>
1
2
3
4
5
6
7
8
┌─────────────────────────┐
│ Tables_in_database │
├─────────────────────────┤
│ COLUMNS │
│ SCHEMATA │
│ TABLES │
│ yuzhouwan_metrics │
└─────────────────────────┘

表结构查询

1
$ bin/plyql --host <broker host>:8082 -q "describe yuzhouwan_metrics"
1
2
3
4
5
6
7
8
┌────────────┬────────┬──────┬─────┬─────────┬───────┐
│ Field │ Type │ Null │ Key │ Default │ Extra │
├────────────┼────────┼──────┼─────┼─────────┼───────┤
│ __time │ TIME │ YES │ │ │ │
│ metric01 │ NUMBER │ YES │ │ │ │
│ metric02 │ NUMBER │ YES │ │ │ │
│ // ... │ │ │ │ │ │
└────────────┴────────┴──────┴─────┴─────────┴───────┘

聚合查询

简单聚合

 简单的 max / min / count 查询语句

1
$ bin/plyql --host <broker host>:8082 -q "select max(gcCount_max) from yuzhouwan_metrics where serverName='druid01'"
1
2
3
4
5
┌──────────────────┐
│ max(gcCount_max) │
├──────────────────┤
│ 39710 │
└──────────────────┘
时间维度聚合

 利用 TIME_PART 进行时间维度的聚合

1
2
3
4
$ bin/plyql --host <broker host>:8082 -q "select TIME_PART(__time, MINUTE_OF_DAY, 'Asia/Shanghai'), max(gcCount_max) from yuzhouwan_metrics where serverName='druid01' and __time>='2017-04-04' and __time<'2017-04-05' group by 1" -Z Asia/Shanghai

# 不参与 group by 的 指标需要进行 sum / min / max 之类的聚合操作
$ bin/plyql --host <broker host>:8082 -q "select TIME_PART(__time, MINUTE_OF_DAY, 'Asia/Shanghai'), metric, sum(sum) as sum_value from yuzhouwan_metrics where level='level1' and metric='metric1' and __time>='2017-04-04' and __time<'2017-04-05' group by 1, 2 order by sum_value desc limit 10" -Z Asia/Shanghai -v

展示查询对应的 JSON 语句

 增加 -v 参数,可以将查询的 JSON 语句展示出来,用于检查 plyql 语句是否符合预期

1
$ bin/plyql --host <broker host>:8082 -q "select distinct level from yuzhouwan_metrics where __time>='2017-01-16 03:00'" -Z Asia/Shanghai -v
1
2
3
4
5
6
7
8
9
10
11
12
13
14
15
16
17
18
19
20
21
22
23
24
25
26
27
28
29
30
31
32
33
34
35
36
37
plyql version 0.9.6 (plywood version 0.15.4)
Received query:
select distinct level from yuzhouwan_metrics where __time>='2017-01-16 03:00'
---------------------------
Parsed query as the following plywood expression (as JSON):
{
"op": "split",
"operand": {
"op": "filter",
"operand": {
"op": "ref",
"name": "yuzhouwan_metrics"
},
"expression": {
"op": "greaterThanOrEqual",
"operand": {
"op": "ref",
"name": "__time",
"ignoreCase": true
}, // ...
{
"version": "v1",
"timestamp": "2017-01-16T03:00:00.000Z",
"event": {
"level": "level1",
"!DUMMY": 1608
}
}
}
]
^^^^^^^^^^^^^^^^^^^^^^^^^^
┌────────────────┐
│ level │
├────────────────┤
│ level1 │
│ level2 │
└────────────────┘

计算查询耗时情况

 利用 time 命令,可以计算出查询语句的耗时情况

1
$ time bin/plyql -h <broker host>:8082 -q "select * from yuzhouwan_metrics where __time>='2017-03-18' and __time<'2017-03-19' and level='level01' limit 100" -Z Asia/Shanghai
1
2
3
real    0m0.886s
user 0m0.684s
sys 0m0.062s

架构

设计总图

初始版本~0.6.0(2012~2013)

Apache Druid 初始构架图

(图片来源:Apache Druid™ 官网)

0.7.0~0.12.0(2013~2018)

Apache Druid 旧构架图 - 数据流转
Apache Druid 旧构架图 - 集群管理

(图片来源:Apache Druid™ 官网)

0.13.0~当前版本(2018~now)

Apache Druid 构架图

(图片来源:Apache Druid™ 官网)
从架构图中,我们可以看出 Apache Druid 集群内通讯是基于 Apache ZooKeeper 的

Lambda 流式架构

Apache Druid Lambda

(利用 Axure™ 绘制而成)
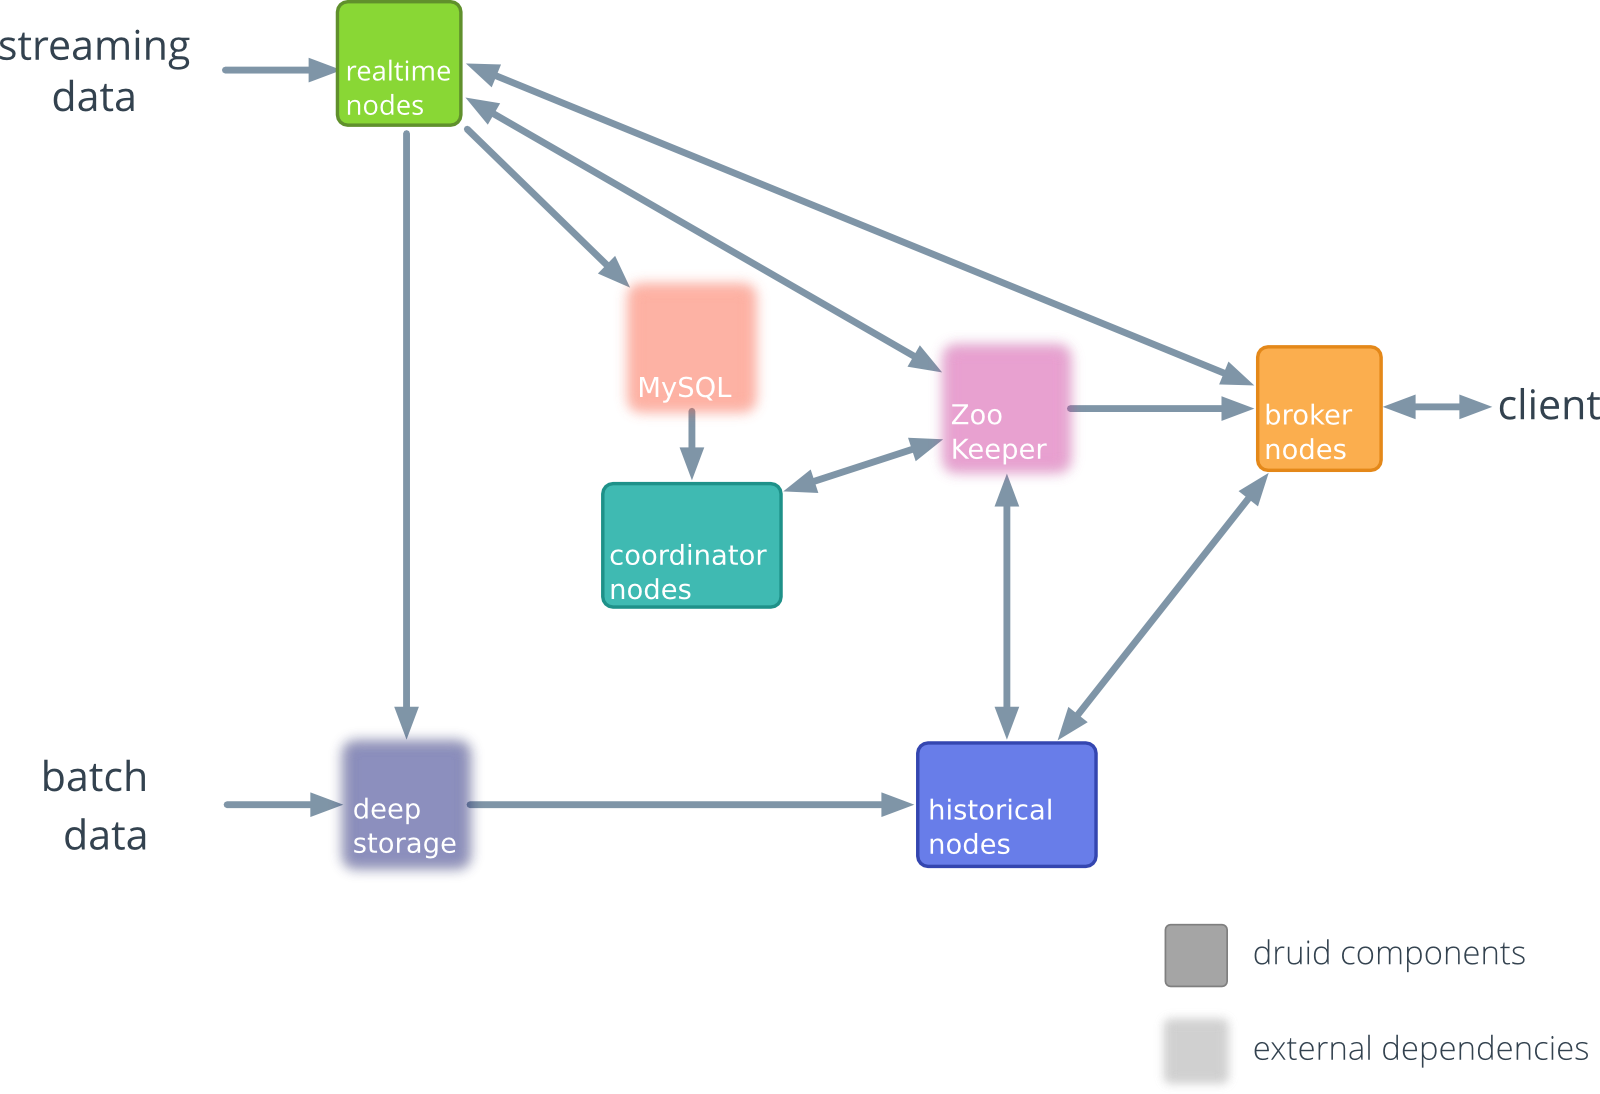
通常流式数据的链路为 Raw data → Kafka → Stream processor(optional, typically for ETL) → Kafka(optional)→ Druid → Application / user,而批处理的链路为 Raw data → Kafka(optional)→ HDFS → ETL process(optional)→ Druid → Application / user
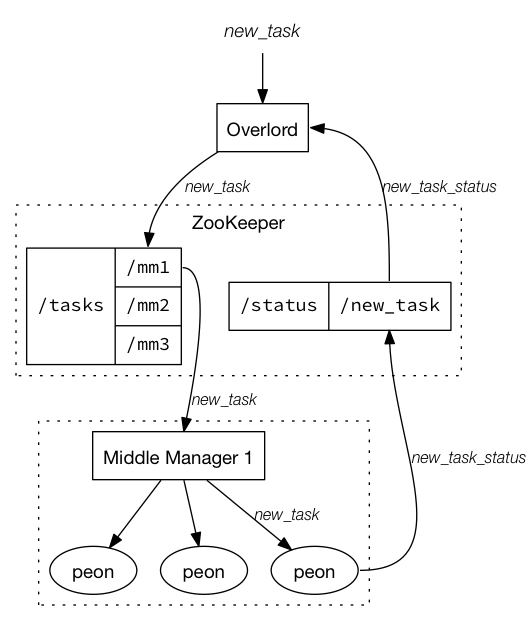
OLTP vs OLAP

OLTP OLAP
全称 Online Transaction Processing Online Analytical Processing
中文 联机事务处理 联机分析处理
技术类别 关系型数据库 数据仓库
场景 基本的、日常的事务处理 复杂的分析操作,侧重决策支持
例子 银行交易 广告投放
面向对象 业务处理人员 分析决策人员
面向维度 应用 主题
实时性 高要求(如,银行交易希望能秒级完成) 低要求(如,报表统计希望能天级完成)
主要操作 增删改 查询
数据的目的 控制和运行基本业务任务 帮助规划、解决问题和决策支持
数据是什么 业务流程的快照 商业活动的多维视图
插入和更新 由终端用户发起 由长时间运行的批处理作业定时触发
查询复杂度 简单事务查询 复杂聚合查询
查询数据量 涉及的记录条数相对较少 涉及大数据量的聚合
处理速度 通常非常快 取决于所涉及的数据量,以及是否建立索引
存储要求 归档历史数据,以节省空间 由于聚合结构的存在,相对更大
数据量级别 GB TB
数据库设计 相对标准化 通常使用较少的表进行非规范化
数据模型 3NF、BCNF 星型、雪花

MOLAP vs ROLAP

MOLAP ROLAP
全称 Multi-dimensional OLAP Relational OLAP
特征 预聚合原始数据,加速聚合查询 MPP 并⾏化 / 内存加速查询
数据库 Apache Druid / Apache Kylin Apache Impala / Aapche Drill / Apache SparkSQL / Presto
MPP(Massively Parallel Processor)大规模并行化处理架构

Task 生命周期

sequenceDiagram

participant Overlord
participant ZooKeeper
participant MiddleManager
participant Peon

Overlord ->> ZooKeeper : new_task
ZooKeeper ->> ZooKeeper : create path /tasks/mm1
ZooKeeper ->> MiddleManager : new_task
MiddleManager ->> Peon : new_task
Peon ->> ZooKeeper : new_task_status
ZooKeeper ->> ZooKeeper : create path /status/new_task
ZooKeeper ->> Overlord : new_task_status

写入链路

sequenceDiagram

participant MiddleManager
participant DeepStorage
participant MetadataStorage
participant ZooKeeper
participant Historical
participant Coordinator

MiddleManager ->> MiddleManager : indexing task
MiddleManager ->> MiddleManager : create segment
MiddleManager ->> DeepStorage : push segment
MiddleManager ->> MetadataStorage : record segment meta info
loop regularly
  Coordinator ->>+ MetadataStorage : pull segment info
  MetadataStorage -->>- Coordinator : return segment info
end
Coordinator ->>+ ZooKeeper : create ephemeral znode
ZooKeeper -->>- Historical : trigger watch
DeepStorage ->> Historical : pull segment
Historical ->> ZooKeeper : record segment location info
Historical -->> MiddleManager : handoff done
Coordinator 会定期从 MetadataStorage 中获取 Segment 信息,拉取的频率由 druid.manager.segments.pollDuration 参数控制(默认值为 PT1M)。另外,druid.manager.config.pollDuration 参数控制拉取配置信息的频率,druid.manager.rules.pollDuration 参数控制拉取 Rule 规则的频率,这两个参数的默认值也均为 PT1M
需要注意的是 Coordinator 通知 Historical 从 DeepStorage 中加载 Segment 的操作,是通过 ZooKeeper 来通讯的,并且每一个 Historical 进程都会与 ZooKeeper 之间维护一个长连接,以感知 watch 机制发出的事件

Segment 加载

sequenceDiagram

participant Historical
participant Disk
participant ZooKeeper

ZooKeeper -->> Historical : CHILD_ADDED event
Historical ->>+ Disk : get all files under info_dir
Disk ->>- Historical : return cached segments info
alt segment does not exist
Historical ->> Disk : delete the corresponding file under info_dir
end
Historical ->> Historical : load local segment
Historical ->> ZooKeeper : register loaded segment
加载 Segment 的过程本质上就是反序列化的过程,如果对 Historical 节点滚动重启的时候,直接对其上的所有 Segment 都进行反序列化操作,会使得节点恢复比较缓慢。针对该问题 Apache Druid 在 0.17.0 版本中,引入了懒加载的机制,将反序列化的过程推迟到 Segment 实际被查询的时候进行。该特性可以通过 druid.segmentCache.lazyLoadOnStart 配置项开启,默认值为 false

 如果某个查询命中的 Segment 都存储在一个 Historical 节点上,则会导致该查询无法被并行化处理,查询的 RT 就会增高。因此,Segment 在各个 Historical 节点中的分布要尽可能保证分散。Segment 负载均衡的策略可以由 druid.coordinator.balancer.strategy 参数指定,默认值为 cost。该策略在 Aapche Druid 的 0.9.1 版本中被引入,其大体思路为:随机选择一个 Segment X 后,依次计算该 Segment X 和 Historical 节点上的所有 Segment Y 的 Cost,选取 Cost 值最小的节点(两个 Segment 对应的时间段相距越远,算出的 Cost 值也就越小,那么同时出现在一个 Historical 节点上的概率也就越大),然后到该节点上重新加载 Segment X。具体的计算公式如下:

 其中,$X$ 为需要被重新加载的 Segment,其数据覆盖的时间范围为 $[x_0, x_1)$,$Y$ 为 Historical 上某一个 Segment,其数据覆盖的时间范围为 $[y_0, y_1)$,另外 $\lambda$ 为 $\frac{\log_e^2}{24}$,表示 Cost 函数的半衰期为 24 小时

 使用 Cost 负载均衡策略后,Segment 在 Historical 节点中的分布情况如下:

Apache Druid Balancer Strategy Cost

(图片来源:Apache Druid™ 的 PR)

 图中,一个点就是一个 Segment,而不同的颜色就用来标识来自不同 DataSource 的 Segment,横坐标表示不同的 Historical 节点,纵坐标表示 Segment 中 Interval 的起始时间

查询链路

sequenceDiagram

participant Client
participant Broker
participant ZooKeeper
participant Historical
participant MiddleManager

Client ->>+ Broker : http request
Broker ->>+ ZooKeeper : get segment location info
ZooKeeper -->>- Broker : return segment location info
Broker ->> Broker : split subquery
Broker ->>+ MiddleManager : query new data
MiddleManager -->>- Broker : return new data
Broker ->>+ Historical : query old data
Historical -->>- Broker : return old data
Broker ->> Broker : merge results
Broker ->>- Client : http response
对于查询来说,Broker 只会将请求分发到 MiddleManager 和 Historical,而 MetadataStorage 和 DeepStorage 都不会参与其中
到这里我们可以看出来,Apache Druid 属于 AP 类型的分布式系统。首先是 Availability 可用性,主要体现于,Apache Druid 集群中不存在单点问题,即便是外部组件 MetadataStorage 和 DeepStorage 全部都宕机,也是可以正常进行数据查询的。其次是 Partition Tolerance 分区容错性,则体现在 Coordinator 可以根据 Rule 设置数据的副本数量,而 DeepStorage 也是可以使用 HDFS 这类支持数据副本的存储媒介。最后是 Consistency 一致性,这一点在 Apache Druid 中相对而言是被弱化的
在默认 v2 版本的 GroupBy 策略下,只有字符串字典会存储在堆内内存,Segment 数据都存储在堆外内存。同时,支持将数据压缩(LZ4)并溢出到磁盘上(通过环境变量 java.io.tmpdir 控制存储路径,默认 Linux 系统下为 /tmp),以避免内存出现 OOM 问题。不过,如果用于溢出的磁盘空间不足,仍会导致查询失败。具体的溢出逻辑,详见:org.apache.druid.query.groupby.epinephelinae.SpillingGrouper#spill。另外,Broker 采用多路归并排序(K-way Merge Sort)算法,将计算结果进行汇总

SQL

sequenceDiagram

participant HTTP Client
participant JDBC Driver
participant SqlResource
participant Avatica Jetty Handler
participant DruidMeta
participant Parser
participant SqlToRelConverter
participant Optimizer
participant Druid Schema
participant Druid RulesSet
participant QueryMaker
participant Query Execution

opt send SQL
HTTP Client ->> SqlResource : /druid/v2/sql
SqlResource ->> Parser : SQL
JDBC Driver ->> Avatica Jetty Handler : /druid/v2/sql/avatica
Avatica Jetty Handler ->> DruidMeta : meta
DruidMeta ->> Parser : SQL
end

opt parse SQL by calcite
Parser ->> SqlToRelConverter : SqlNode
SqlToRelConverter ->> Optimizer : RelNode
Optimizer ->> QueryMaker : DruidRel
end

opt execute SQL
QueryMaker ->> Query Execution : Query
end

Query Execution -->> HTTP Client : Result

整体知识树

Apache Druid

(利用 MindNode™ 绘制而成)

应用场景

Powered By

 从 Apache Druid 官网看到全球上百家企业正在使用,也包括了很多国内的公司,例如 BAT、字节跳动™、知乎™、优酷™、小米™、Oppo™、有赞™、作业帮™等等,大概占到 10% 左右

主要应用

  • 点击流分析(Web 和 移动端分析)

  • 风控

  • 网络遥测分析(网络性能监控)

分类 协议 优点 缺点
主动测量 PING、Traceroute、Iperf、IPMP、OWAMP、TWAMP、MPLS L/DM、Pingmesh 易用且灵活 网络增加额外带宽 / 处理开销,会引起海森堡测不准效应
被动测量 Netflow、sFlow、IPFIX、PSAMP 不会因测量产生额外的负载 只能监测交换节点本地状态信息,而不能监测网络状态和丢包率等全局状态信息
混合测量 Reactive Measurement、In-band Measurement、AM-PM、Postcard Based Telemetry、In-band Flow Analyzer、Hybrid Two Steps 能够对网络拓扑、网络性能和网络流量实现更细粒度的测量 1. 带内网络遥测检测范围有限,预先定义的随路检测特性使得带内网络遥测往往无法及时获得全网全状态的网络视图。因此,带内网络遥测只能监测特定路径上的某些数据包的遥测数据;
2. 由于将遥测指令和数据封装到正常数据包中,正常数据包的有效载荷比降低,遥测开销较大;
3. 遥测指令和数据的构造、封装、填充和提取等环节增加了交换机处理负担
  • 服务器指标存储

  • 供应链分析(制造指标)

  • 应用程序性能指标

  • 商业智能 / OLAP

适合的场景

  • 插入率很高,但更新并不常见
  • 大多数查询都是聚合查询和 groupBy 分组查询,包括搜索和扫描查询
  • 查询响应时间为百毫秒~几秒钟之间
  • 时序数据
  • 可能有多个表,但是每个查询仅命中其中某一个表
  • 具有高基数数据列(例如 URL,用户 ID 等),并且需要对其进行快速计数和排序
  • 要从 Kafka,HDFS,本地文件或 Amazon S3、AliyunOSS 之类的对象存储中加载数据
Apache Druid 支持将 groupBy 查询的中间结果溢出存储至磁盘,以应对大查询导致的内存资源不足。通过 druid.query.groupBy.maxOnDiskStorage 配置项可以控制对应的磁盘空间大小,默认值为 0,表示不开启该特性

不合适的场景

  • 使用主键对现有记录进行低延迟更新。Druid 支持流式插入,但不支持流式更新(使用后台批处理作业完成更新)
  • 正在构建脱机报告系统,此时查询延迟不是很重要
网上关于 Apache Druid 教程有很多,其中也会提及一些缺点,但是 Apache Druid 社区发展是十分迅速的,例如“不支持 SQL”、“无法进行 Join 操作”、“不能存储明细数据”之类的说法,现在已经不再适用,希望大家能够以 Apache Druid 官网提供的最新版本为准

性能测试

 TPC™(Transactionprocessing Performance Council,事务处理性能委员会)是一个发布基准程序的标准规范的非盈利组织。基于 TPC 定义的 TPC-H 规范,麻省大学定义了一套基准测试规范,可用于测试数据库产品在星型模式下的性能表现,即 SSBStar Schema Benchmark)。它将 TPC-H 的雪花模式简化为了星型模式,将基准查询由 TPC-H 的复杂 Ad-Hoc 查询改为了结构更固定的 OLAP 查询

Apache Druid Benchmark with Partition Hashing On
Apache Druid Benchmark with Partition Hashing Off

(图片来源:Imply™ 官网)

源码阅读

数据结构

R-tree

 一个空间数据库由一系列对应空间对象的 tuple 组成,而每一个 tuple 具有一个唯一标示(tuple identifier,简称 tupleID),数据库可以通过这个唯一标示获取到该 tuple。R-Tree 所做的就是将这些 tupleID 索引起来

HyperLogLog

 基数计数会得到一个近似精确的计算结果,比如在执行 Count / Distinct Count 等计数查询的时候,会返回一个浮点数作为预估值

依赖框架

Apache Calcite 查询引擎

Google Guice 注入

Google Guava 扩展库

JMH 压测

Query 查询流程

Apache Druid Query Process

(利用 StarUML™ 绘制而成)

数据持久化过程

 Apache Druid 支持的数据类型非常多,这里仅以 Long 数据类型为例,如下所示:

Apache Druid data persist process

点击这里查看完整大图

可视化

Apache Superset

 出于篇幅考虑,单独写了一篇博客,详见:Apache Superset 二次开发

Grafana

安装 Grafana

1
2
3
# 使用 Helm Chart 安装 Grafana
$ helm repo add bitnami https://charts.bitnami.com/bitnami
$ helm install my-release bitnami/grafana -n test-new-grafana
1
2
3
4
5
6
7
8
9
10
11
12
13
14
15
16
NAME: my-release
LAST DEPLOYED: Mon Jul 19 08:03:13 2020
NAMESPACE: test-new-grafana
STATUS: deployed
REVISION: 1
TEST SUITE: None
NOTES:
** Please be patient while the chart is being deployed **

1. Get the application URL by running these commands:
echo "Browse to http://127.0.0.1:8080"
kubectl port-forward svc/my-release-grafana 8080:3000 &

2. Get the admin credentials:
echo "User: admin"
echo "Password: $(kubectl get secret my-release-grafana-admin --namespace test-new-grafana -o jsonpath="{.data.GF_SECURITY_ADMIN_PASSWORD}" | base64 --decode)"

安装 Druid 插件

通过 Grafana Client 客户端
1
2
# 使用 Grafana Client 安装 abhisant-druid-datasource 插件,以支持在 Grafana 中创建 Druid 类型的 DataSource
$ grafana-cli --pluginsDir "${GF_PATHS_PLUGINS}" plugins install abhisant-druid-datasource
通过 Yaml 配置文件
1
2
$ helm repo add grafana https://grafana.github.io/helm-charts
$ helm search repo grafana
1
2
3
4
5
6
7
8
9
10
11
12
13
14
15
16
17
18
19
20
21
22
23
24
25
26
27
NAME                                	CHART VERSION	APP VERSION      	DESCRIPTION
bitnami/grafana 8.2.21 9.3.2 Grafana is an open source metric analytics and ...
bitnami/grafana-loki 2.5.3 2.7.1 Grafana Loki is a horizontally scalable, highly...
bitnami/grafana-operator 2.7.13 4.8.0 Grafana Operator is a Kubernetes operator that ...
bitnami/grafana-tempo 1.4.6 1.5.0 Grafana Tempo is a distributed tracing system t...
grafana/grafana 6.50.7 9.3.6 The leading tool for querying and visualizing t...
grafana/grafana-agent 0.5.0 v0.31.0 Grafana Agent
grafana/grafana-agent-operator 0.2.10 0.31.0 A Helm chart for Grafana Agent Operator
grafana/enterprise-logs 2.4.3 v1.5.2 Grafana Enterprise Logs
grafana/enterprise-logs-simple 1.2.1 v1.4.0 DEPRECATED Grafana Enterprise Logs (Simple Scal...
grafana/enterprise-metrics 1.9.0 v1.7.0 DEPRECATED Grafana Enterprise Metrics
grafana/fluent-bit 2.3.2 v2.1.0 Uses fluent-bit Loki go plugin for gathering lo...
grafana/loki 4.6.0 2.7.3 Helm chart for Grafana Loki in simple, scalable...
grafana/loki-canary 0.10.0 2.6.1 Helm chart for Grafana Loki Canary
grafana/loki-distributed 0.69.4 2.7.3 Helm chart for Grafana Loki in microservices mode
grafana/loki-simple-scalable 1.8.11 2.6.1 Helm chart for Grafana Loki in simple, scalable...
grafana/loki-stack 2.9.9 v2.6.1 Loki: like Prometheus, but for logs.
grafana/mimir-distributed 4.0.1 2.5.0 Grafana Mimir
grafana/mimir-openshift-experimental 2.1.0 2.0.0 Grafana Mimir on OpenShift Experiment
grafana/oncall 1.1.23 v1.1.23 Developer-friendly incident response with brill...
grafana/phlare 0.1.3 0.1.2 🔥 horizontally-scalable, highly-available, mul...
grafana/promtail 6.8.2 2.7.2 Promtail is an agent which ships the contents o...
grafana/rollout-operator 0.2.0 v0.2.0 Grafana rollout-operator
grafana/synthetic-monitoring-agent 0.1.0 v0.9.3-0-gcd7aadd Grafana Synthetic Monitoring application. The...
grafana/tempo 1.0.0 2.0.0 Grafana Tempo Single Binary Mode
grafana/tempo-distributed 1.0.1 2.0.0 Grafana Tempo in MicroService mode
grafana/tempo-vulture 0.2.1 1.3.0 Grafana Tempo Vulture - A tool to monitor Tempo...
1
2
$ helm fetch grafana/grafana --version 6.50.7 --untar
$ vim grafana/values.yaml
1
2
3
4
5
6
7
8
# 添加 Druid 插件
plugins:
- abhisant-druid-datasource

# 建议开启持久化,避免数据丢失的风险
persistence:
type: pvc
enabled: true
1
$ helm install ./grafana --generate-name --values grafana/values.yaml --namespace "test-new-grafana" --create-namespace
1
2
3
4
5
6
7
8
9
10
11
12
13
14
15
16
17
18
19
NAME: grafana-1675914054
LAST DEPLOYED: Sat Feb 4 11:40:54 2023
NAMESPACE: test-new-grafana
STATUS: deployed
REVISION: 1
NOTES:
1. Get your 'admin' user password by running:

kubectl get secret --namespace test-new-grafana grafana-1675914054 -o jsonpath="{.data.admin-password}" | base64 --decode ; echo

2. The Grafana server can be accessed via port 80 on the following DNS name from within your cluster:

grafana-1675914054.test-new-grafana.svc.cluster.local

Get the Grafana URL to visit by running these commands in the same shell:
export POD_NAME=$(kubectl get pods --namespace test-new-grafana -l "app.kubernetes.io/name=grafana,app.kubernetes.io/instance=grafana-1675914054" -o jsonpath="{.items[0].metadata.name}")
kubectl --namespace test-new-grafana port-forward $POD_NAME 3000

3. Login with the password from step 1 and the username: admin

暴露 Grafana 服务

1
2
3
# 在 POC 阶段,使用 port-forward 暴露 Grafana 的 3000 服务端口
# 在正式生产环境中,建议使用 externalIPs 的方式,进行服务暴露
$ kill `ps -ef | grep 3000 | grep -v grep | awk '{print $2}'`; export POD_NAME=$(kubectl get pods | grep grafana | awk '{print $1}') ; nohup kubectl port-forward $POD_NAME 3000:3000 --address 0.0.0.0 2>&1 &

删除 Grafana 服务

1
$ helm delete -n test-new-grafana `helm list -n test-new-grafana | grep -v NAME | head -1 | awk '{print $1}'`
1
release "grafana-1675914054" uninstalled
1
$ kubectl delete ns test-new-grafana
1
namespace "test-new-grafana" deleted

Pivot

配置启动

1
2
3
4
5
6
7
8
9
10
11
12
13
14
15
16
17
$ whereis node
node: /usr/local/bin/node

$ /usr/local/bin/node -v
v4.2.2

# 将环境变量引入,而不用 sudo su druid
$ su - druid

# `--with-comments` 指标可以去掉不用,避免 comment 生成出现问题(部分注释,行开头漏 # 号的情况)
$ /usr/local/bin/node /home/druid/software/druid/dist/pivot/bin/pivot --druid <druid.broker.host>:8082 --print-config > /home/druid/software/druid/dist/pivot/bin/yuzhouwan_metrics.yaml

# 需要使用相对路径
$ cd /home/druid/software/imply-2.0.0
$ nohup dist/pivot/bin/pivot -c /home/druid/software/druid/dist/pivot/bin/config_yuzhouwan_metrics.yaml >> /home/druid/software/druid/dist/pivot/bin/nohup.log 2>&1 &

$ vim /home/druid/software/druid/dist/pivot/bin/config_yuzhouwan_metrics.yaml
1
2
3
4
# 在 pivot 的配置文件中,可以利用简单的表达式,进行计算,如:除以采集的时间窗口,算得 `OPS`
- name: metrics02_OPS
title: metrics02 ops
expression: $main.sum($metrics02_Sum) / $main.sum($period_Sum)

效果图

HBase Metrics in Pivot

(对 Pivot™ 可视化页面的截图)
在 Apache Druid 的 27.0.0 版本中,简化版的 Pivot 已经作为 Router 的一部分发布了

踩过的坑

指标项过多,维护配置困难
解决

 可以通过 列转行 的方式,在 dimensions 里面增加一个 metric 维度,来管理指标项。如此,可以有效地避免在 metricsSpec 里面维护大量的指标。同时,也方便了动态新增指标项

 不过,列换行 也会带来数据膨胀的问题。如果在资源受限的情况下,很可能还是得在 metricsSepc 里面维护指标。这样的话,可以使用我写的 DruidUtils 来快速生成配置文件,避免手动去维护配置

Graphite

基础环境

OS
1
2
3
4
5
6
7
8
9
10
11
12
13
$ uname -a
Linux olap03-sit.yuzhouwan.com 2.6.32-431.el6.x86_64 #1 SMP Fri Nov 22 03:15:09 UTC 2013 x86_64 x86_64 x86_64 GNU/Linux

$ cat /proc/version
Linux version 2.6.32-431.el6.x86_64 (mockbuild@c6b8.bsys.dev.centos.org) (gcc version 4.4.7 20120313 (Red Hat 4.4.7-4) (GCC) ) #1 SMP Fri Nov 22 03:15:09 UTC 2013

# For Fedora and RHEL-derivatives
$ sudo yum upgrade python-setuptools -y
$ sudo yum install openssl openssl-devel install zlib zlib-devel readline readline-devel sqlite-devel libffi-devel -y

# Machines
druid.yuzhouwan.com 10.10.10.1 Druid
graphite.yuzhouwan.com 192.168.1.101 Graphite
Python
1
2
3
4
5
6
7
8
9
10
11
12
13
14
15
16
17
18
19
20
21
22
23
24
25
26
27
28
29
30
31
32
33
34
35
36
37
38
39
40
41
42
43
44
$ python --version
Python 2.7.8

[Note]: Superset is tested using Python 2.7 and Python 3.4+. Python 3 is the recommended version, Python 2.6 won't be supported.'

## 升级 Python(stable: Python 2.7.12 | 3.4.5, lastest: Python 3.5.2 [2016/12/15])
https://www.python.org/downloads/

# 在 python ftp 服务器中下载到 对应版本的 python
$ wget http://python.org/ftp/python/2.7.12/Python-2.7.12.tgz

# 编译
$ tar -zxvf Python-2.7.12.tgz
$ cd /root/software/Python-2.7.12
$ ./configure --prefix=/usr/local/python27
$ make && make install

$ ls /usr/local/python27/ -al

drwxr-xr-x. 6 root root 4096 12月 15 14:22 .
drwxr-xr-x. 13 root root 4096 12月 15 14:20 ..
drwxr-xr-x. 2 root root 4096 12月 15 14:22 bin
drwxr-xr-x. 3 root root 4096 12月 15 14:21 include
drwxr-xr-x. 4 root root 4096 12月 15 14:22 lib
drwxr-xr-x. 3 root root 4096 12月 15 14:22 share


# 覆盖原来的 python6
$ which python
/usr/local/bin/python

$ mv /usr/local/bin/python /usr/local/bin/python_old
$ ln -s /usr/local/python27/bin/python /usr/local/bin/

$ python -V
Python 2.7.12

# 修改 yum 引用的 python 版本为旧版 2.6 的 python
$ vim /usr/bin/yum
# 第一行修改为 python2.6
#!/usr/bin/python2.6

$ yum --version | sed '2,$d'
3.2.29
Pip
1
2
3
4
5
6
7
8
9
10
11
12
13
14
15
16
17
18
19
20
21
22
23
24
25
26
$ pip --version
pip 9.0.1 from /usr/local/lib/python2.7/site-packages (python 2.7)

# upgrade setup tools and pip
$ pip install --upgrade setuptools pip

## Offline 环境下安装 pip
# https://pypi.python.org/pypi/setuptools#code-of-conduct 下载 setuptools-32.0.0.tar.gz
$ tar zxvf setuptools-32.0.0.tar.gz
$ cd setuptools-32.0.0

$ cd setuptools-32.0.0
$ python setup.py install

# https://pypi.python.org/pypi/pip 下载 pip-9.0.1.tar.gz
$ wget --no-check-certificate https://pypi.python.org/packages/11/b6/abcb525026a4be042b486df43905d6893fb04f05aac21c32c638e939e447/pip-9.0.1.tar.gz#md5=35f01da33009719497f01a4ba69d63c9
$ tar zxvf pip-9.0.1.tar.gz
$ cd pip-9.0.1
$ python setup.py install

Installed /usr/local/python27/lib/python2.7/site-packages/pip-9.0.1-py2.7.egg
Processing dependencies for pip==9.0.1
Finished processing dependencies for pip==9.0.1

$ pip --version
pip 9.0.1 from /root/software/pip-9.0.1 (python 2.7)
VirtualEnv
1
2
3
4
5
6
7
8
9
10
11
12
13
14
$ pip install virtualenv

# virtualenv is shipped in Python 3 as pyvenv
$ virtualenv venv
$ . ./venv/bin/activate

## Offline 环境下安装 virtualenv
# https://pypi.python.org/pypi/virtualenv#downloads 下载 virtualenv-15.1.0.tar.gz
$ tar zxvf virtualenv-15.1.0.tar.gz
$ cd virtualenv-15.1.0
$ python setup.py install

$ virtualenv --version
15.1.0

Graphite 相关

安装
1
2
3
4
5
6
7
8
9
10
11
12
13
14
15
16
17
18
19
20
21
22
23
24
25
26
27
28
29
30
31
32
33
34
35
36
37
38
39
40
# root@graphite-sit.yuzhouwan.com (192.168.1.102)
$ cd /opt
$ virtualenv -p /usr/local/bin/python --system-site-packages graphite
$ cd graphite
$ source bin/activate

$ pip install https://github.com/graphite-project/ceres/tarball/master (ceres-0.10.0rc1)
$ pip install whisper (whisper-0.9.15)

# trouble shooting
$ which python
/root/graphite/bin/python (in virtualenv, otherwise "/usr/local/bin/python")

$ ll /root/graphite/bin/whisper*py
-rwxr-xr-x 1 root root 2847 Jan 3 17:06 /root/graphite/bin/whisper-create.py
-rwxr-xr-x 1 root root 2208 Jan 3 17:06 /root/graphite/bin/whisper-diff.py
-rwxr-xr-x 1 root root 2912 Jan 3 17:06 /root/graphite/bin/whisper-dump.py
-rwxr-xr-x 1 root root 1790 Jan 3 17:06 /root/graphite/bin/whisper-fetch.py
-rwxr-xr-x 1 root root 4309 Jan 3 17:06 /root/graphite/bin/whisper-fill.py
-rwxr-xr-x 1 root root 1081 Jan 3 17:06 /root/graphite/bin/whisper-info.py
-rwxr-xr-x 1 root root 685 Jan 3 17:06 /root/graphite/bin/whisper-merge.py
-rwxr-xr-x 1 root root 5994 Jan 3 17:06 /root/graphite/bin/whisper-resize.py
-rwxr-xr-x 1 root root 929 Jan 3 17:06 /root/graphite/bin/whisper-set-aggregation-method.py
-rwxr-xr-x 1 root root 980 Jan 3 17:06 /root/graphite/bin/whisper-update.py


$ pip install carbon (carbon-0.9.15 constantly-15.1.0 incremental-16.10.1 twisted-16.6.0 txamqp-0.6.2 zope.interface-4.3.3)

# trouble shooting
$ ll /root/graphite/bin/carbon*py
-rwxr-xr-x 1 root root 1095 Jan 3 17:12 /root/graphite/bin/carbon-aggregator.py
-rwxr-xr-x 1 root root 1095 Jan 3 17:12 /root/graphite/bin/carbon-cache.py
-rwxr-xr-x 1 root root 4498 Jan 3 17:12 /root/graphite/bin/carbon-client.py
-rwxr-xr-x 1 root root 1095 Jan 3 17:12 /root/graphite/bin/carbon-relay.py

$ pip install graphite-web
$ pip install cairocffi

# pip freeze | grep graphite-web
# graphite-web==0.9.15
graphite 配置
1
2
3
4
5
6
7
8
9
10
11
12
13
14
15
16
17
18
19
20
21
22
23
24
25
26
27
28
29
30
31
32
33
34
35
36
37
38
39
40
41
42
43
44
45
46
47
48
49
$ cd /root/graphite/conf      (otherwise /opt/graphite/conf)

$ ls -sail
total 72
-rw-r--r-- 1 root root 1798 Jan 3 17:54 aggregation-rules.conf.example
-rw-r--r-- 1 root root 274 Jan 3 17:54 blacklist.conf.example
-rw-r--r-- 1 root root 2594 Jan 3 17:54 carbon.amqp.conf.example
-rw-r--r-- 1 root root 17809 Jan 3 17:54 carbon.conf.example
-rw-r--r-- 1 root root 888 Jan 3 17:54 relay-rules.conf.example
-rw-r--r-- 1 root root 558 Jan 3 17:54 rewrite-rules.conf.example
-rw-r--r-- 1 root root 827 Jan 3 17:54 storage-aggregation.conf.example
-rw-r--r-- 1 root root 489 Jan 3 17:54 storage-schemas.conf.example
-rw-r--r-- 1 root root 315 Jan 3 17:54 whitelist.conf.example

$ cp aggregation-rules.conf.example aggregation-rules.conf
$ cp blacklist.conf.example blacklist.conf
$ cp carbon.amqp.conf.example carbon.amqp.conf
$ cp carbon.conf.example carbon.conf
# following 3 conf files need to install graphite-web firstly
$ cp dashboard.conf.example dashboard.conf
$ cp graphite.wsgi.example graphite.wsgi
$ cp graphTemplates.conf.example graphTemplates.conf
#
$ cp relay-rules.conf.example relay-rules.conf
$ cp rewrite-rules.conf.example rewrite-rules.conf
$ cp storage-aggregation.conf.example storage-aggregation.conf
$ cp storage-schemas.conf.example storage-schemas.conf
$ cp whitelist.conf.example whitelist.conf

$ /root/graphite/bin/carbon-cache.py start

Starting carbon-cache (instance a)

# trouble shooting
$ ps -ef | grep carbon
root 12074 1 0 18:58 ? 00:00:00 /root/graphite/bin/python /root/graphite/bin/carbon-cache.py start

$ vim /root/graphite/conf/carbon.conf
# carbon.conf 文件中,在 cache 区段下,接收端口这一行包含一个默认值,用于通过平文本协议(plaintext protocol)接受输入指标项
[cache]
LINE_RECEIVER_INTERFACE = 0.0.0.0
LINE_RECEIVER_PORT = 2003

$ yum install nc -y
# echo "<metric path> <metric value> <metric timestamp>" | nc -q0 ${SERVER} ${PORT}
$ echo "carbon.agents.graphite-tutorial.metricsReceived 28198 `date +%s`" | nc -c localhost 2003

# Carbon 与 Whisper 交互,将这些时间序列数据存储到文件系统中,可以用 whisper-info 脚本获取为这些指标项创建的 Whisper 文件的元数据信息
$ /root/graphite/bin/whisper-info.py /root/graphite/storage/whisper/carbon/agents/graphite-tutorial/metricsReceived.wsp
graphite web 应用
1
2
3
4
5
6
7
8
9
10
11
12
13
14
15
16
17
18
19
20
21
22
23
24
25
26
27
28
29
30
31
32
33
34
35
# dependency
# pip install Django==1.9.12 会导致 'WSGIRequest' object has no attribute 'REQUEST' 异常
$ pip install django==1.8.17
$ pip install django-tagging

# configure
$ cd /root/graphite/lib/python2.7/site-packages/opt/graphite/webapp/graphite
$ cp local_settings.py.example local_settings.py
# 创建 SQLite3 数据库 & 赋读写权限 & 修改 local_settings.py

$ cd /root/graphite/conf
$ cp dashboard.conf.example dashboard.conf
$ cp graphTemplates.conf.example graphTemplates.conf

# init database
$ cd /root/graphite/lib/python2.7/site-packages/opt/graphite/webapp/graphite/
$ python /root/graphite/lib/python2.7/site-packages/opt/graphite/webapp/graphite/manage.py syncdb

Would you like to create one now? (yes/no): yes
Username (leave blank to use 'root'): graphite
Email address: bj@yuzhouwan.com
Password:
Password (again):
Superuser created successfully.

# start
$ mkdir -p /root/graphite/storage/log/webapp/
$ echo '' > /root/graphite/storage/log/webapp/process.log
$ cd /root/graphite
$ PYTHONPATH=/root/graphite/storage/whisper /root/graphite/bin/run-graphite-devel-server.py --port=8085 --libs=/root/graphite/lib/python2.7/site-packages/opt/graphite/webapp /root/graphite 1>/root/graphite/storage/log/webapp/process.log 2>&1 &
# 或者用,python /root/graphite/lib/python2.7/site-packages/opt/graphite/webapp/graphite/manage.py runserver 0.0.0.0:8085

# trouble shooting
$ tail -f /root/graphite/storage/log/webapp/process.log
http://192.168.1.102:8085/
graphite events
1
2
# PYTHONPATH=$GRAPHITE_ROOT/webapp django-admin.py migrate --settings=graphite.settings --run-syncdb
$ PYTHONPATH=/root/graphite/lib/python2.7/site-packages/opt/graphite/webapp django-admin.py migrate --settings=graphite.settings --run-syncdb
1
2
3
4
5
6
7
8
9
10
Operations to perform:
Synchronize unmigrated apps: account, cli, render, whitelist, metrics, url_shortener, dashboard, composer, events, browser
Apply all migrations: admin, contenttypes, tagging, auth, sessions
Synchronizing apps without migrations:
Creating tables...
Running deferred SQL...
Running migrations:
Rendering model states... DONE
Applying admin.0002_logentry_remove_auto_add... OK
Applying auth.0007_alter_validators_add_error_messages... OK
1
$ curl -X POST "http://10.10.10.2:8085/events/" -d '{ "what": "Event - deploy", "tags": ["deploy"], "when": 1467844481, "data": "deploy of master branch happened at Wed Jul  6 22:34:41 UTC 2016" }'
1
2
3
# trouble shooting
http://10.10.10.2:8085/events/ graphite events when what tags
22:34:41 Wed 06 Jul 2016 Event - deploy [u'deploy']
1
$ curl -s "http://10.10.10.2:8085/render/?target=events('exception')&format=json" | json_pp
1
2
3
4
5
6
7
8
9
10
11
12
13
14
15
[
{
"target": "events(exception)",
"datapoints": [
[
1,
1388966651
],
[
3,
1388966652
]
]
}
]
graphite-index
1
2
3
4
5
6
7
8
9
10
11
# douban new UI for graphite
$ git clone https://github.com/douban/graph-index.git
$ cd graph-index

$ vim config.py
graphite_url = 'http://192.168.1.101:9097'

$ crontab -e
*/5 * * * * python /root/software/graphite-index

$ python /graph-index.py

整合 Druid

迁移到内网环境
1
2
3
4
5
6
7
8
9
10
11
12
13
14
15
16
17
18
19
20
21
22
23
24
25
26
27
28
29
30
31
32
33
34
35
36
37
38
39
40
41
42
43
44
45
46
47
48
49
50
51
52
53
# 192.168.1.102 to 10.10.10.2 (sit)

# ps -ef | grep graphite # 关闭所有进程
# rsync 替换 scp 可以确保软链接也能被 cp(补充:用 tar zcvf 打包也是不能解决的)
$ rsync -avuz -e ssh /root/graphite root@10.10.10.2:/root

# 192.168.1.102 to 192.168.2.101 to 192.168.1.101 (product)
$ rsync -avuz -e ssh /root/graphite jinjy@192.168.2.101:/home/jinjy
$ rsync -avuz -e ssh /home/jinjy/graphite root@192.168.1.101:/root

# default: --port=8085
$ /root/graphite/bin/carbon-cache.py start
$ PYTHONPATH=/root/graphite/storage/whisper /root/graphite/bin/run-graphite-devel-server.py --port=9097 --libs=/root/graphite/lib/python2.7/site-packages/opt/graphite/webapp /root/graphite 1>/root/graphite/storage/log/webapp/process.log 2>&1 &

# trouble shooting
$ ps -ef | grep graphite
root 30754 1 0 15:42 ? 00:00:00 /root/graphite/bin/python /root/graphite/bin/carbon-cache.py start
root 30825 28048 3 15:43 pts/1 00:00:00 /root/graphite/bin/python /root/graphite/bin/django-admin runserver --pythonpath /root/graphite/webapp --settings graphite.settings 0.0.0.0:9097
root 30829 30825 5 15:43 pts/1 00:00:00 /root/graphite/bin/python /root/graphite/bin/django-admin runserver --pythonpath /root/graphite/webapp --settings graphite.settings 0.0.0.0:9097

$ cd /root/graphite/storage/log/carbon-cache/carbon-cache-a
tail -f console.log creates.log listener.log # carbon 接收 event 事件相关的日志记录
tail -f /root/graphite/storage/log/webapp/process.log

http://192.168.1.101:9097/


# virtualenv
$ rsync -avuz -e ssh /root/software jinjy@192.168.1.101:/home/jinjy
$ rsync -avuz -e ssh /home/jinjy/software/Python-2.7.12.tgz root@192.168.1.101:/root/software

$ cd /root/software
$ tar zxvf Python-2.7.12.tgz
$ cd Python-2.7.12

$ ./configure --prefix=/usr --enable-shared CFLAGS=-fPIC
$ make -j4 && make -j4 install
$ /sbin/ldconfig -v | grep /
$ python -V
Python 2.7.12


# 虽然软链接已经 rsync 过来了,但是目标机器相关目录下,没有对应的 python 的动态链接库
$ file /root/graphite/lib/python2.7/lib-dynload
/root/graphite/lib/python2.7/lib-dynload: broken symbolic link to `/usr/local/python27/lib/python2.7/lib-dynload' '`


# 需要和联网环境中,创建 virtualenv 时的 python 全局环境一致
$ ./configure --prefix=/usr/local/python27 --enable-shared CFLAGS=-fPIC
$ make -j4 && make -j4 install
$ /sbin/ldconfig -v | grep /

$ ls /usr/local/python27/lib/python2.7/lib-dynload -sail
修改 Druid 配置
1
2
3
4
5
6
7
8
$ sudo su druid
$ cd /home/druid/software/druid

$ find | grep common.runtime.properties | grep -v quickstart | grep -v dist
./conf/druid/_common/common.runtime.properties

$ cp /home/druid/software/druid/conf/druid/_common/common.runtime.properties /home/druid/software/druid/conf/druid/_common/common.runtime.properties.bak
$ vim /home/druid/software/druid/conf/druid/_common/common.runtime.properties
1
2
3
4
5
6
7
8
9
10
11
12
13
14
15
16
17
18
19
20
21
22
23
24
25
26
27
28
29
30
31
32
33
34
35
36
37
38
39
40
41
42
43
44
45
46
47
48
49
50
51
52
53
54
55
56
57
58
59
60
61
62
63
64
65
66
67
68
69
70
71
72
73
74
75
76
# module
druid.extensions.loadList=[..., "graphite-emitter"]
#
# Monitoring
#
druid.monitoring.monitors=["com.metamx.metrics.JvmMonitor"]
druid.emitter=http
#druid.emitter=logging
druid.emitter.logging.logLevel=info
druid.emitter.http.recipientBaseUrl=http://10.37.2.142:9999/metrics

# monitor
druid.monitoring.monitors=["com.metamx.metrics.JvmMonitor"]
druid.emitter=composing
druid.emitter.composing.emitters=["graphite", "logging"]
druid.emitter.graphite.hostname=localhost
# 端口需要注意,不是 2003(即,非 /root/graphite/conf/carbon.conf 中的 LINE_RECEIVER_PORT or LINE_RECEIVER_PORT,而是 PICKLE_RECEIVER_PORT)
druid.emitter.graphite.port=2004
# druid.emitter.graphite.eventConverter={"type":"whiteList", "namespacePrefix": "cluster_x", "ignoreHostname":true, "ignoreServiceName":false, "mapFile":"/a/b/c"}
druid.emitter.graphite.eventConverter={"ingest/events/thrownAway":["dataSource"],"ingest/events/unparseable":["dataSource"],"ingest/events/processed":["dataSource"],"ingest/handoff/failed":["dataSource"],"ingest/persists":[],"ingest/rows/output":[],"jvm/gc":[],"jvm/mem":[],"query/cpu/time":["dataSource","type"],"query/node/time":["dataSource","type"],"query/node/ttfb":["dataSource","type"],"query/partial/time":["dataSource","type"],"query/segment/time":["dataSource","type"],"query/segmentAndCache/time":["dataSource","type"],"query/time":["dataSource","type"],"query/wait/time":["dataSource","type"],"segment/count":[],"segment/dropQueue/count":[],"segment/loadQueue/count":[],"segment/loadQueue/failed":[],"segment/loadQueue/size":[],"segment/scan/pending":[],"segment/size":[],"segment/usedPercent":[]}
druid.emitter.logging.logLevel=info


druid.emitter.graphite.eventConverter={"type":"all", "namespacePrefix": "druid", "ignoreHostname": false, "ignoreServiceName": false}
## pertty format start ##
{
"ingest/events/thrownAway": ["dataSource"],
"ingest/events/unparseable": ["dataSource"],
"ingest/events/processed": ["dataSource"],
"ingest/handoff/failed": ["dataSource"],
"ingest/persists": [],
"ingest/rows/output": [],
"jvm/gc": [],
"jvm/mem": [],
"query/cpu/time": [
"dataSource",
"type"
],
"query/node/time": [
"dataSource",
"type"
],
"query/node/ttfb": [
"dataSource",
"type"
],
"query/partial/time": [
"dataSource",
"type"
],
"query/segment/time": [
"dataSource",
"type"
],
"query/segmentAndCache/time": [
"dataSource",
"type"
],
"query/time": [
"dataSource",
"type"
],
"query/wait/time": [
"dataSource",
"type"
],
"segment/count": [],
"segment/dropQueue/count": [],
"segment/loadQueue/count": [],
"segment/loadQueue/failed": [],
"segment/loadQueue/size": [],
"segment/scan/pending": [],
"segment/size": [],
"segment/usedPercent": []
}
## pertty format end ##
1
2
3
4
5
6
# kill historical process to make configure activate
$ jps -m
1867 Main server historical
26339 Main server middleManager

$ kill 1867
校验
1
$ tail -f var/sv/supervise.log
1
2
3
[Thu Jan  5 11:18:17 2017] Running command[historical], logging to[/home/druid/software/imply-2.0.0/var/sv/historical.log]: bin/run-druid historical conf
[Thu Jan 5 11:18:21 2017] Command[historical] exited (pid = 1752, exited = 1)
[Thu Jan 5 11:18:21 2017] Command[historical] failed, see logfile for more details: /home/druid/software/imply-2.0.0/var/sv/historical.log
1
$ tail -f  /home/druid/software/imply-2.0.0/var/sv/historical.log
1
2017-01-05T11:34:29,203 INFO [GraphiteEmitter-1] io.druid.emitter.graphite.GraphiteEmitter - trying to connect to graphite server
如果连接不上,会报错 ERROR [GraphiteEmitter-1] io.druid.emitter.graphite.GraphiteEmitter - 拒绝连接,则需要检查 Graphite 进程是否运行正常

优化配置

依赖
Django
1
2
3
4
5
6
7
8
$ pip freeze | grep Django
Django==1.8

$ pip install --upgrade Django
Successfully installed Django-1.10.5

$ pip uninstall Django
$ pip install Django==1.8.17
高版本 Django 会导致 'WSGIRequest' object has no attribute 'REQUEST' 异常
Graphite-Web 相关
1
$ vim requirements.txt
1
2
3
4
5
6
7
8
9
python-memcached==1.47
txAMQP==0.4
simplejson==2.1.6
django-tagging==0.4.3
gunicorn
pytz
pyparsing==1.5.7
cairocffi
whitenoise
1
$ pip install -r requirements.txt
采集
1
$ vim /root/graphite/conf/storage-schemas.conf
1
2
3
4
5
6
7
8
9
[carbon]
pattern = ^carbon\.
retentions = 60:90d

[default_1min_for_1day]
pattern = .*
# retentions = 60s:1d
# 改为 3 种时间粒度
retentions = 10s:6h,1m:7d,10m:1y
监控
1
$ python /root/graphite/examples/example-client.py
1
2
3
4
5
6
sending message

-----------------------------------------------------
system.loadavg_1min 0.26 1483690449
system.loadavg_5min 0.30 1483690449
system.loadavg_15min 0.35 1483690449
启动命令汇总
1
2
3
4
5
$ python /root/graphite/lib/python2.7/site-packages/opt/graphite/webapp/graphite/manage.py syncdb
$ PYTHONPATH=/root/graphite/lib/python2.7/site-packages/opt/graphite/webapp django-admin.py migrate --settings=graphite.settings --run-syncdb

$ /root/graphite/bin/carbon-cache.py start
$ PYTHONPATH=/root/graphite/storage/whisper /root/graphite/bin/run-graphite-devel-server.py --port=9097 --libs=/root/graphite/webapp /root/graphite 1>/root/graphite/storage/log/webapp/process.log 2>&1 &

踩过的坑

ImportError: No module named carbon.util
描述
1
2
3
4
5
(graphite) [root@graphite-sit.yuzhouwan.com conf]# /root/graphite/bin/carbon-cache.py start
Traceback (most recent call last):
File "/root/graphite/bin/carbon-cache.py", line 28, in <module>
from carbon.util import run_twistd_plugin
ImportError: No module named carbon.util
解决
  • 检查 carbon 是否已安装
1
$ pip freeze
1
2
3
4
5
6
7
8
carbon==0.9.15
ceres==0.10.0rc1
constantly==15.1.0
incremental==16.10.1
Twisted==16.6.0
txAMQP==0.6.2
whisper==0.9.15
zope.interface==4.3.3
  • graphiteˊs default prefix (/opt/graphite)
1
2
$ mv /root/graphite/lib/python2.7/site-packages/opt/graphite/lib/carbon /root/graphite/lib/python2.7/site-packages/
$ mv /root/graphite/lib/python2.7/site-packages/opt/graphite/lib/twisted/plugins/carbon_* /root/graphite/lib/python2.7/site-packages/twisted/plugins/
django.db.utils.OperationalError: unable to open database file
描述
1
$ python manage.py syncdb
1
2
3
4
5
6
7
8
9
/root/graphite/lib/python2.7/site-packages/opt/graphite/webapp/graphite/settings.py:246: UserWarning: SECRET_KEY is set to an unsafe default. This should be set in local_settings.py for better security
warn('SECRET_KEY is set to an unsafe default. This should be set in local_settings.py for better security')
Traceback (most recent call last):
File "manage.py", line 13, in <module>
execute_from_command_line(sys.argv)
File "/root/graphite/lib/python2.7/site-packages/django/core/management/__init__.py", line 338, in execute_from_command_line
utility.execute()
// ...
django.db.utils.OperationalError: unable to open database file
解决
  • change default SECRET_KEY in settings.py
1
$ vim /root/graphite/lib/python2.7/site-packages/opt/graphite/webapp/graphite/settings.py
1
2
3
# Django 1.5 requires this so we set a default but warn the user
# SECRET_KEY = 'UNSAFE_DEFAULT'
SECRET_KEY = 'graphite'
  • change DATABASE_NAME in sqlites
1
2
3
4
5
6
7
8
9
10
11
12
13
14
15
16
17
18
19
$ mkdir /root/graphite/sqlite
$ cd /root/graphite/sqlite

# create database
$ sqlite3 graphite.db
$ sqlite3
sqlite>.help
sqlite>.databases
seq name file
--- --------------- ------------------------------------------
0 main /root/graphite/sqlite/graphite.db

Crtl + D (exit like python)

# change DATABASE_NAME
DATABASE_NAME='/root/graphite/sqlite/graphite.db'
echo $DATABASE_NAME

# run 'python manage.py syncdb' again, then the graphite database disappeared
  • modify settings.py for sqlite database
1
2
3
4
5
$ cd /root/graphite/storage
$ mkdir db
$ cd db
$ sqlite3 graphite.db
$ vim /root/graphite/lib/python2.7/site-packages/django/conf/project_template/project_name/settings.py
1
2
3
4
5
6
7
8
9
10
11
12
13
14
15
16
17
18
# GRAPHITE_STORAGE_DIR = '/root/graphite/sqlite/graphite.db'

#DATABASES = {
# 'default': {
# 'ENGINE': 'django.db.backends.sqlite3',
# 'NAME': os.path.join(BASE_DIR, 'db.sqlite3'),
# }
#}
DATABASES = {
'default': {
'ENGINE': 'django.db.backends.sqlite3', # Add 'postgresql_psycopg2', 'postgresql', 'mysql', 'sqlite3' or 'oracle'.
'NAME': '/root/graphite/storage/db/graphite.db', # Or path to database file if using sqlite3.
'USER': '', # Not used with sqlite3.
'PASSWORD': '', # Not used with sqlite3.
'HOST': '', # Set to empty string for localhost. Not used with sqlite3.
'PORT': '', # Set to empty string for default. Not used with sqlite3.
}
}
1
2
# trouble shooting
$ sqlite3 /root/graphite/storage/db/graphite.db
1
2
3
4
5
6
7
SQLite version 3.6.20
Enter ".help" for instructions
Enter SQL statements terminated with a ";"
sqlite> .databases
seq name file
--- --------------- --------------------------------------
0 main /root/graphite/storage/db/graphite.db
1
2
$ cd /root/graphite/
$ find | grep /settings.py | grep -v pyc
1
2
3
4
./lib/python2.7/site-packages/opt/graphite/webapp/graphite/settings.py
./lib/python2.7/site-packages/tagging/tests/settings.py
./lib/python2.7/site-packages/tagging/settings.py
./lib/python2.7/site-packages/django/conf/project_template/project_name/settings.py
全部修改完成,即可修复
  • 检查 Django 是否版本过低(<= v1.4)
1
$ django-admin version
1
1.8
  • 检查访问权限
1
2
3
4
5
6
7
8
9
$ cut -d: -f1 /etc/passwd | grep graphite
$ echo $USER
root

$ cd /root/graphite/storage/db
$ sudo chown root:root graphite.db
$ sudo chmod o+rw graphite.db
$ sudo chmod o+rwx db/
$ sudo chmod o+rwx ../webapp/
ImportError: No module named graphite.settings
描述
1
$ ./bin/run-graphite-devel-server.py --port=8085 --libs=/root/graphite/webapp /root/graphite 1>/root/graphite/storage/log/webapp/process.log 2>&1 &
1
2
3
4
5
6
7
8
9
10
11
12
13
14
15
16
17
tail: /root/graphite/storage/log/webapp/process.log: file truncated
Traceback (most recent call last):
File "/root/graphite/bin/django-admin", line 11, in <module>
sys.exit(execute_from_command_line())
File "/root/graphite/lib/python2.7/site-packages/django/core/management/__init__.py", line 338, in execute_from_command_line
utility.execute()
File "/root/graphite/lib/python2.7/site-packages/django/core/management/__init__.py", line 303, in execute
settings.INSTALLED_APPS
File "/root/graphite/lib/python2.7/site-packages/django/conf/__init__.py", line 48, in __getattr__
self._setup(name)
File "/root/graphite/lib/python2.7/site-packages/django/conf/__init__.py", line 44, in _setup
self._wrapped = Settings(settings_module)
File "/root/graphite/lib/python2.7/site-packages/django/conf/__init__.py", line 92, in __init__
mod = importlib.import_module(self.SETTINGS_MODULE)
File "/usr/local/python27/lib/python2.7/importlib/__init__.py", line 37, in import_module
__import__(name)
ImportError: No module named graphite.settings
解决
  • 修改 local_settings.py
1
$ vim /root/graphite/lib/python2.7/site-packages/opt/graphite/webapp/graphite/local_settings.py
1
2
3
4
5
6
7
8
9
10
DATABASES = {
'default': {
'ENGINE': 'django.db.backends.sqlite3', # Add 'postgresql_psycopg2', 'postgresql', 'mysql', 'sqlite3' or 'oracle'.
'NAME': '/root/graphite/storage/db/graphite.db', # Or path to database file if using sqlite3.
'USER': '', # Not used with sqlite3.
'PASSWORD': '', # Not used with sqlite3.
'HOST': '', # Set to empty string for localhost. Not used with sqlite3.
'PORT': '', # Set to empty string for default. Not used with sqlite3.
}
}
  • 指定 PYTHONPATH
1
2
3
4
5
6
$ PYTHONPATH=/root/graphite/storage/whisper /root/graphite/bin/run-graphite-devel-server.py --port=8085 --libs=/root/graphite/webapp /root/graphite 1>/root/graphite/storage/log/webapp/process.log 2>&1 &

# new problem
ImportError: Cannot import either sping or piddle.

$ PYTHONPATH=/root/graphite/storage/whisper /root/graphite/bin/run-graphite-devel-server.py --port=8085 --libs=/root/graphite/lib/python2.7/site-packages/opt/graphite/webapp /root/graphite 1>/root/graphite/storage/log/webapp/process.log 2>&1 &
OError: [Errno 2] No such file or directory: ‘/root/graphite/lib/python2.7/site-packages/opt/graphite/storage/log/webapp/info.log’
描述

 访问 http://192.168.1.102:8085/ 返回如下信息:

1
2
3
4
5
6
7
Traceback (most recent call last):
File "/root/graphite/lib/python2.7/site-packages/django/core/handlers/base.py", line 119, in get_response
resolver_match = resolver.resolve(request.path_info)
# ...
File "/usr/local/python27/lib/python2.7/logging/__init__.py", line 943, in _open
stream = open(self.baseFilename, self.mode)
IOError: [Errno 2] No such file or directory: '/root/graphite/lib/python2.7/site-packages/opt/graphite/storage/log/webapp/info.log'
解决
  • 增加 info.log 文件
1
2
$ mkdir -p /root/graphite/lib/python2.7/site-packages/opt/graphite/storage/log/webapp/
$ echo '' > /root/graphite/lib/python2.7/site-packages/opt/graphite/storage/log/webapp/info.log
Graphite Web 页面无 event 数据
描述
1
2
3
4
5
6
7
8
9
10
11
12
13
14
15
16
17
# 访问 http://192.168.1.101:9097/events/

# 在 Druid 中是能看到 historical 进程的确在产生数据,并且成功连接到了 graphite
$ tail -f /home/druid/software/imply-2.0.0/var/sv/historical.log

2017-01-05T11:34:29,203 INFO [GraphiteEmitter-1] io.druid.emitter.graphite.GraphiteEmitter - trying to connect to graphite server
# 如果连接不上,会报错 ERROR [GraphiteEmitter-1] io.druid.emitter.graphite.GraphiteEmitter - 拒绝连接
# 则检查 graphite 进程是否正常


# 在 Graphite 中也能看到数据被收到了
$ cd /root/graphite/storage/log/carbon-cache/carbon-cache-a
$ tail -f console.log creates.log listener.log

05/01/2017 20:05:18 :: Sorted 75 cache queues in 0.000208 seconds
# 如果数据有误,会报错 05/01/2017 20:32:32 :: invalid line ((L1483619493L) received from client 10.10.10.1:41752, ignoring
# 则检查 druid emitter 配置是否正常
解决
  • 是否是 SQLite 数据库没有成功存储
1
2
3
4
5
6
7
8
9
10
11
12
13
14
15
16
17
18
19
20
21
22
23
24
25
26
27
28
29
30
31
32
33
34
35
36
37
38
39
40
41
42
43
44
45
46
47
48
49
50
51
52
53
54
55
56
57
58
59
60
61
62
63
64
65
66
67
68
69
70
71
72
73
74
75
76
77
78
79
80
81
82
83
84
85
86
87
88
89
90
91
92
93
94
95
96
97
98
99
100
101
102
103
104
105
106
107
108
# graphite 配置没有问题
$ vim /root/graphite/lib/python2.7/site-packages/django/conf/project_template/project_name/settings.py

DATABASES = {
'default': {
'ENGINE': 'django.db.backends.sqlite3', # Add 'postgresql_psycopg2', 'postgresql', 'mysql', 'sqlite3' or 'oracle'.
'NAME': '/root/graphite/storage/db/graphite.db', # Or path to database file if using sqlite3.
'USER': '', # Not used with sqlite3.
'PASSWORD': '', # Not used with sqlite3.
'HOST': '', # Set to empty string for localhost. Not used with sqlite3.
'PORT': '', # Set to empty string for default. Not used with sqlite3.
}
}

# 发现 sqlite 中并没有将 events 记录下来
(graphite) [root@kylin03-pre db]# sqlite3 /root/graphite/storage/db/graphite.db
SQLite version 3.6.20
Enter ".help" for instructions
Enter SQL statements terminated with a ";"
sqlite> .databases
seq name file
--- --------------- ----------------------------------------
0 main /root/graphite/storage/db/graphite.db
sqlite> .tables
account_mygraph dashboard_dashboard
account_profile dashboard_dashboard_owners
account_variable django_admin_log
account_view django_content_type
account_window django_migrations
auth_group django_session
auth_group_permissions events_event
auth_permission tagging_tag
auth_user tagging_taggeditem
auth_user_groups url_shortener_link
auth_user_user_permissions
sqlite> select * from auth_user;
1|pbkdf2_sha256$20000$oEgzveEmcg9B$8xbilUymXlwVBAaB48xpUQwsfIucmeP/4C4YF3U6SlI=|1|graphite|||bj@yuzhouwan.com|1|1|2017-01-04 05:59:10.615950|2017-01-05 08:24:54.957631
2|pbkdf2_sha256$20000$gG1lK6FNg0h7$dXH47Wqc+Gj/qTyI6EKOajd+Pj1kKN+U5CtnmDo0K/0=|0|default|||default@localhost.localdomain|0|1|2017-01-04 06:53:34.687401|
3|pbkdf2_sha256$20000$fcQ5sYbw0cjk$anjZc4J0eRE51HGJ6D50c0c9+d08iY7lhWseke9RmEY=|0|druid||||0|1|2017-01-05 09:03:48.696161|
sqlite> select * from events_event; # no data!

# 尝试使用 MySQL 替换 SQLite
# 192.168.1.102
$ mkdir -p /root/software/mysql
yum install -y --downloadonly --downloaddir=/root/software/mysql mysql
yum install -y --downloadonly --downloaddir=/root/software/mysql mysql-server
yum install -y --downloadonly --downloaddir=/root/software/mysql MySQL-python
# 192.168.1.101
yum install -y mysql mysql-server MySQL-python

$ cd /root/software/mysql
$ wget http://dev.mysql.com/get/mysql57-community-release-el5-7.noarch.rpm
$ yum localinstall mysql57-community-release-el5-7.noarch.rpm
$ yum repolist enabled | grep "mysql.*-community.*"
$ yum install mysql-community-server
$ vim /usr/bin/yum-config-manager
#!/usr/bin/python2.6 -tt

$ yum-config-manager --enable mysql57-community
$ service mysqld start

$ mysql -uroot -p -S /home/mysql/data/mysql.sock

# 后面规范化部署的时候,可以创建 graphite 用户,并赋权
CREATE DATABASE graphite;
# GRANT ALL PRIVILEGES ON graphite.* TO 'graphite'@'localhost' IDENTIFIED BY 'sysadmin';
GRANT ALL PRIVILEGES ON graphite.* TO 'root'@'localhost' IDENTIFIED BY 'sysadmin';
FLUSH PRIVILEGES;

$ vim /root/graphite/lib/python2.7/site-packages/django/conf/project_template/project_name/settings.py

DATABASES = {
'default': {
'ENGINE': 'django.db.backends.mysql',
# 'NAME': 'jdbc:mysql://192.168.1.101:3306/graphite',
'NAME': 'graphite',
'USER': 'root',
# 'HOST': 'localhost',
'PASSWORD': 'root'
}
}
# TIME_ZONE = 'UTC'
TIME_ZONE = 'Asia/Shanghai'
# DEBUG = False
DEBUG = True

$ cd /root/graphite/
$ find | grep /settings.py | grep -v pyc
$ vim /root/graphite/lib/python2.7/site-packages/opt/graphite/webapp/graphite/settings.py
$ vim /root/graphite/lib/python2.7/site-packages/tagging/tests/settings.py
$ vim /root/graphite/lib/python2.7/site-packages/tagging/settings.py
# ./lib/python2.7/site-packages/django/conf/project_template/project_name/settings.py

# 全部修改完成,即可修复

$ python /root/graphite/lib/python2.7/site-packages/opt/graphite/webapp/graphite/manage.py syncdb
# 如果需要添加其他的 superuser,可以使用如下命令 admin/admin
# echo "from django.contrib.auth.models import User; User.objects.create_superuser('admin', 'admin@hihuron.com', 'sysadmin')" | python /root/graphite/lib/python2.7/site-packages/opt/graphite/webapp/graphite/manage.py shell

$ /root/graphite/bin/carbon-cache.py start
$ PYTHONPATH=/root/graphite/storage/whisper /root/graphite/bin/run-graphite-devel-server.py --port=9097 --libs=/root/graphite/lib/python2.7/site-packages/opt/graphite/webapp /root/graphite 1>/root/graphite/storage/log/webapp/process.log 2>&1 &

$ cd /root/graphite/webapp
$ cp -r content/ /root/graphite/lib/python2.7/site-packages/opt/graphite/webapp
$ cd /root/graphite/lib/python2.7/site-packages/opt/graphite/webapp
$ cp -r graphite/ /root/graphite/webapp

$ PYTHONPATH=/root/graphite/storage/whisper /root/graphite/bin/run-graphite-devel-server.py --port=9097 --libs=/root/graphite/webapp /root/graphite 1>/root/graphite/storage/log/webapp/process.log 2>&1 &
ImportError: No module named twisted.python.util
描述
1
$ python carbon-cache.py start
1
2
3
4
5
6
Traceback (most recent call last):
File "carbon-cache.py", line 28, in <module>
from carbon.util import run_twistd_plugin
File "/opt/graphite/lib/carbon/util.py", line 20, in <module>
from twisted.python.util import initgroups
ImportError: No module named twisted.python.util
解决
1
2
3
4
5
6
# pip freeze | grep zope.interface # 没有则需要安装
# pip install zope.interface==3.6.0
$ wget https://pypi.python.org/packages/source/T/Twisted/Twisted-14.0.0.tar.bz2#md5=9625c094e0a18da77faa4627b98c9815 --no-check-certificate
$ tar -jxf Twisted-14.0.0.tar.bz2
$ cd Twisted-14.0.0;
$ python setup.py install
‘WSGIRequest’ object has no attribute ‘REQUEST’
描述

 访问 http://192.168.1.102:9097/ 返回如下信息:

1
2
3
4
5
6
7
8
9
10
11
12
13
14
15
16
17
18
19
20
21
22
23
24
25
26
27
28
29
30
31
32
33
34
35
36
37
38
39
AttributeError at /render/
'WSGIRequest' object has no attribute 'REQUEST'
Request Method: GET
Request URL: http://192.168.1.102:9097/render/?width=586&height=308&_salt=1483685265.903
Django Version: 1.9.12
Exception Type: AttributeError
Exception Value:
'WSGIRequest' object has no attribute 'REQUEST'
Exception Location: /root/graphite/webapp/graphite/render/views.py in parseOptions, line 236
Python Executable: /root/graphite/bin/python
Python Version: 2.7.12
Python Path:
['/root/graphite/webapp',
'/root/graphite/webapp',
'/root/graphite/bin',
'/root/graphite/webapp',
'/root/graphite/storage/whisper',
'/root/graphite/lib/python27.zip',
'/root/graphite/lib/python2.7',
'/root/graphite/lib/python2.7/plat-linux2',
'/root/graphite/lib/python2.7/lib-tk',
'/root/graphite/lib/python2.7/lib-old',
'/root/graphite/lib/python2.7/lib-dynload',
'/usr/local/python27/lib/python2.7',
'/usr/local/python27/lib/python2.7/plat-linux2',
'/usr/local/python27/lib/python2.7/lib-tk',
'/root/graphite/lib/python2.7/site-packages',
'/root/graphite/lib/python2.7/site-packages/graphite-0.71-py2.7.egg',
'/root/graphite/lib/python2.7/site-packages/spring-5.8.7-py2.7-linux-x86_64.egg',
'/root/graphite/lib/python2.7/site-packages/Twisted-12.0.0-py2.7-linux-x86_64.egg',
'/root/graphite/lib/python2.7/site-packages/requests-2.1.0-py2.7.egg',
'/root/graphite/lib/python2.7/site-packages/numpy-1.12.0rc2-py2.7-linux-x86_64.egg',
'/root/graphite/lib/python2.7/site-packages/logger-1.4-py2.7.egg',
'/root/graphite/lib/python2.7/site-packages/decorator-4.0.10-py2.7.egg',
'/root/graphite/lib/python2.7/site-packages/sping-1.1.15-py2.5.egg',
'/usr/local/python27/lib/python2.7/site-packages',
'/root/graphite/webapp/graphite/thirdparty']
Server time: Fri, 6 Jan 2017 14:47:46 +0800
解决

 该问题是由于 Django 版本不匹配导致的,安装 1.8.17 版本即可

1
django==1.8.17

踩过的坑

true / false 存为维度后变成了 NULL

解决

 Druid 本身是无法将 true / false 之类的 boolean 类型作为维度的,可以考虑将 "true" / "false" 字符串作为维度存入。但是,如果自定义的 Bean 对象中,有 String isTimeout = "false" 的属性存在,就不能直接使用 JSON.toJSONString 进行转换。因为 toJSONString 方法中会识别出 "true" / "false" 字符串,并将其自动转化为 boolean 类型。因此,需要将所有字段都存入 Map<String, Object> 数据结构中,然后再调用 JSON.toJSONString 方法即可

1
$ bin/plyql --host localhost:8082 -q "select * from log"
1
2
3
4
5
6
7
8
9
10
┌─────────────────────────────────────────┬───────┬───────────┬─────┬─────┬──────┬──────────────────────────────────────┐
│ __time │ count │ isTimeout │ max │ min │ sum │ uuid │
├─────────────────────────────────────────┼───────┼───────────┼─────┼─────┼──────┼──────────────────────────────────────┤
│ Wed Aug 02 2017 17:35:00 GMT+0800 (CST) │ 4 │ NULL │ 860 │ 860 │ 3440 │ 4621a23d-8270-4bc3-948a-f577b460d72b │
│ Wed Aug 02 2017 17:42:00 GMT+0800 (CST) │ 1 │ NULL │ 860 │ 860 │ 860 │ 4621a23d-8270-4bc3-948a-f577b460d72b │
│ Wed Aug 02 2017 17:44:00 GMT+0800 (CST) │ 1 │ NULL │ 860 │ 860 │ 860 │ 4621a23d-8270-4bc3-948a-f577b460d72b │
│ Wed Aug 02 2017 18:03:00 GMT+0800 (CST) │ 3 │ NULL │ 0 │ 0 │ 0 │ 85f030bd-d737-4863-9af1-e6fd8bd3b15c │
│ Wed Aug 02 2017 19:01:24 GMT+0800 (CST) │ 2 │ NULL │ 0 │ 0 │ 0 │ 85f030bd-d737-4863-9af1-e6fd8bd3b15c │
│ Wed Aug 02 2017 19:09:49 GMT+0800 (CST) │ 1 │ false │ 0 │ 0 │ 0 │ ba11de00-7faf-4eaf-a8ea-1cf3c5033de5 │
└─────────────────────────────────────────┴───────┴───────────┴─────┴─────┴──────┴──────────────────────────────────────┘

Pool was initialized with limit = 0

描述

 在执行 RESTful 查询语句的时候,出现如下报错:

1
2
3
4
5
6
{
"error": "Unknown exception",
"errorClass": "java.lang.IllegalStateException",
"errorMessage": "Pool was initialized with limit = 0, there are no objects to take.",
"host": "druid01:8101"
}

解决

 检查 Broker、Historical、MiddleManger 是否都已经配置了 druid.processing.numMergeBuffers 参数

1
2
$ cd /home/druid/software/druid/conf/druid
$ cat broker/runtime.properties historical/runtime.properties middleManager/runtime.properties | grep numMergeBuffers
1
2
3
druid.processing.numMergeBuffers=4

No buckets?? seems there is no data to index

解决

 除去 HDFS 里面的确没有数据的情况,还有可能是因为 Hadoop 任务的 TimeZone 没有设置正确

1
2
"mapreduce.map.java.opts":"-Duser.timezone=UTC -Dfile.encoding=UTF-8"
"mapreduce.reduce.java.opts":"-Duser.timezone=UTC -Dfile.encoding=UTF-8"

hyperUniqueCardinality 输出浮点数,导致 having 无法使用 equalTo 进行过滤

描述

 以下查询使用了 hyperUniqueCardinality 近似查询,导致 alias-6 输出的值为浮点数(如 10.0000213),所以导致了无法在 having 中使用 equalTo 进行精确过滤(=10)

1
2
3
4
5
6
7
8
9
10
11
12
13
14
15
16
17
18
19
20
21
22
23
24
25
26
27
28
29
30
31
32
33
34
35
36
37
38
39
40
41
42
43
44
45
46
47
48
49
{
"jsonClass": "GroupByQuerySpec",
"queryType": "groupBy",
"dataSource": "yuzhouwan",
"dimensions": [
{
"jsonClass": "ExtractionDimensionSpec",
"type": "extraction",
"dimension": "__time",
"outputName": "alias-4",
"extractionFn": {
"jsonClass": "TimeFormatExtractionFunctionSpec",
"type": "timeFormat",
"format": "yyyy-MM-dd",
"timeZone": "Asia/Shanghai",
"locale": "en_US"
}
}
],
"having": {
"jsonClass": "ComparisonHavingSpec",
"type": "greaterThan",
"aggregation": "alias-6",
"value": 10
},
"granularity": "all",
"aggregations": [
{
"type": "hyperUnique",
"name": "alias-5",
"fieldName": "__HLL_booksnumber1"
}
],
"postAggregations": [
{
"jsonClass": "HyperUniqueCardinalityPostAggregationSpec",
"type": "hyperUniqueCardinality",
"fieldName": "alias-5",
"name": "alias-6"
}
],
"intervals": [
"2018-08-08T00:00:00.000+08:00/2018-08-18T00:00:00.000+08:00"
],
"context": {
"queryId": "yuzhouwan-127.0.0.1-3395157377882475",
"groupByStrategy": "v2"
}
}

解决

 通过在 postAggregations 中,增加一个 JavaScript post-aggregator 计算过程,再利用 Math.round 进行四舍五入即可

1
2
3
4
5
6
7
8
9
10
11
12
13
14
15
16
17
18
19
20
21
22
23
24
25
26
27
28
29
30
31
32
33
34
35
36
37
38
39
40
41
42
43
44
45
46
47
48
49
50
51
52
53
54
55
56
57
{
"jsonClass": "GroupByQuerySpec",
"queryType": "groupBy",
"dataSource": "yuzhouwan",
"dimensions": [
{
"jsonClass": "ExtractionDimensionSpec",
"type": "extraction",
"dimension": "__time",
"outputName": "alias-4",
"extractionFn": {
"jsonClass": "TimeFormatExtractionFunctionSpec",
"type": "timeFormat",
"format": "yyyy-MM-dd",
"timeZone": "Asia/Shanghai",
"locale": "en_US"
}
}
],
"having": {
"jsonClass": "ComparisonHavingSpec",
"type": "equalTo",
"aggregation": "alias-6",
"value": 10
},
"granularity": "all",
"aggregations": [
{
"type": "hyperUnique",
"name": "alias-5",
"fieldName": "__HLL_booksnumber1"
}
],
"postAggregations": [
{
"jsonClass": "HyperUniqueCardinalityPostAggregationSpec",
"type": "hyperUniqueCardinality",
"fieldName": "alias-5",
"name": "alias6"
},
{
"type": "javascript",
"name": "alias-6",
"fieldNames": [
"alias6"
],
"function": "function(alias6) { return Math.round(alias6); }"
}
],
"intervals": [
"2018-08-08T00:00:00.000+08:00/2018-08-16T00:00:00.000+08:00"
],
"context": {
"queryId": "yuzhouwan-127.0.0.1-3395157377882475",
"groupByStrategy": "v2"
}
}

修改 Apache Druid 的默认时区

解决

1
2
$ cd /opt/druid/conf/druid/cluster
$ find . -name jvm.config
1
2
3
4
5
./data/middleManager/jvm.config
./data/historical/jvm.config
./query/router/jvm.config
./query/broker/jvm.config
./master/coordinator-overlord/jvm.config
1
$ grep 'user.timezone' `find . -name jvm.config`
1
2
3
4
5
./data/middleManager/jvm.config:-Duser.timezone=UTC
./data/historical/jvm.config:-Duser.timezone=UTC
./query/router/jvm.config:-Duser.timezone=UTC
./query/broker/jvm.config:-Duser.timezone=UTC
./master/coordinator-overlord/jvm.config:-Duser.timezone=UTC
1
$ sed -in-place -e 's/-Duser.timezone=UTC/-Duser.timezone=UTC+8/g' `find . -name jvm.config`
1
$ grep 'user.timezone' `find . -name jvm.config`
1
2
3
4
5
./data/middleManager/jvm.config:-Duser.timezone=UTC+8
./data/historical/jvm.config:-Duser.timezone=UTC+8
./query/router/jvm.config:-Duser.timezone=UTC+8
./query/broker/jvm.config:-Duser.timezone=UTC+8
./master/coordinator-overlord/jvm.config:-Duser.timezone=UTC+8
Apache Druid 的默认时区是 UTC,这里我们以东八区为例,将 user.timezone 属性改为 UTC+8 即可

查询延迟升高

解决

 有一种可能,是 Historical 负载均衡速度过快导致的。通过 Router 页面或者 API 接口,将 Max segments to move 和 Balancer compute threads 参数调整为 10 和 2(甚至可以是 5 和 1),可以适当降低 Segment 负载均衡的速度,避免其占用过多的资源

Router 中的 ingestion 页面展示 task 列表太慢

解决

1
2
3
# 登录 PostgreSQL 清理非活跃的 task 记录
$ psql -U druid
> delete from druid_tasks where active='f';

写入任务提交失败

描述

 Kafka Ingestion 写入任务在提交过程中失败了,报错 Error: Request failed with status code 500,配置如下:

1
2
3
4
5
6
{
"bootstrap.servers": "yuzhouwan01:9093,yuzhouwan02:9093,yuzhouwan03:9093",
"security.protocol": "SASL_PLAINTEXT",
"sasl.mechanism": "PLAIN",
"sasl.jaas.config": "org.apache.kafka.common.security.plain.PlainLoginModule required username=\"asdf2014\" password=\"yuzhouwan\""
}

解决

 配置有误导致的,在 sasl.jaas.config 配置项的末尾缺少分号:

1
2
3
4
5
6
{
"bootstrap.servers": "yuzhouwan01:9093,yuzhouwan02:9093,yuzhouwan03:9093",
"security.protocol": "SASL_PLAINTEXT",
"sasl.mechanism": "PLAIN",
"sasl.jaas.config": "org.apache.kafka.common.security.plain.PlainLoginModule required username=\"asdf2014\" password=\"yuzhouwan\";"
}
此外,Kafka Ingestion 写入任务提交失败,还有一种可能是上游 Kafka Topic 是新创建的,里面还没有写入任何数据

写入任务运行失败,但没有报错日志

描述

 写入任务在运行过程中失败了,但是任务日志中并没有 ERROR 级别的日志报错

解决

 有一种可能,是 HDFS Router 列表过长导致 Druid 与 Hadoop 通讯的时间成本上升。如果,写入任务长时间卡在这一步,会被误认为是无响应的 task 而被删除掉。所以,我们需要减少 hdfs-site.xml 文件里中定义的 HDFS Router 的列表长度,裁剪掉不必要的 HDSF Router 节点,具体操作如下所示:

1
$ vi conf/druid/cluster/_common/hdfs-site.xml
1
2
3
4
5
6
7
8
9
10
11
12
13
14
15
16
17
18
19
20
21
<!-- 只保留一个即可,保留十多个 HDFS Router 反而会影响性能和稳定性 -->
<property>
<name>dfs.internal.nameservices</name>
<value>yuzhouwan_router</value>
</property>
<property>
<name>dfs.nameservices</name>
<value>yuzhouwan_router</value>
</property>
<property>
<name>dfs.nameservices.dfsrouter</name>
<value>yuzhouwan_router</value>
</property>
<property>
<name>dfs.nameservices.hdfs_client</name>
<value>yuzhouwan_router</value>
</property>
<property>
<name>dfs.nameservices.namenode</name>
<value>yuzhouwan_router</value>
</property>

写入任务运行失败,报错 duplicate key value

描述

 写入任务在运行过程过程中失败了,任务日志中有如下报错:

1
2
3
4
5
6
7
8
9
10
11
12
13
14
15
16
17
18
19
20
21
22
23
24
25
26
Caused by: org.skife.jdbi.v2.exceptions.UnableToExecuteStatementException: org.postgresql.util.PSQLException: ERROR: duplicate key value violates unique constraint "druid_pendingsegments_pkey"

// ...

Caused by: org.postgresql.util.PSQLException: ERROR: duplicate key value violates unique constraint "druid_pendingsegments_pkey"
Detail: Key (id)=(yuzhouwan_2024-01-06T11:15:00.000Z_2024-01-06T11:30:00.000Z_2024-01-06T11:15:00.092Z_12) already exists.
at org.postgresql.core.v3.QueryExecutorImpl.receiveErrorResponse(QueryExecutorImpl.java:2284) ~[?:?]
at org.postgresql.core.v3.QueryExecutorImpl.processResults(QueryExecutorImpl.java:2003) ~[?:?]
at org.postgresql.core.v3.QueryExecutorImpl.execute(QueryExecutorImpl.java:200) ~[?:?]
at org.postgresql.jdbc.PgStatement.execute(PgStatement.java:424) ~[?:?]
at org.postgresql.jdbc.PgPreparedStatement.executeWithFlags(PgPreparedStatement.java:161) ~[?:?]
at org.postgresql.jdbc.PgPreparedStatement.execute(PgPreparedStatement.java:155) ~[?:?]
at org.apache.commons.dbcp2.DelegatingPreparedStatement.execute(DelegatingPreparedStatement.java:198) ~[commons-dbcp2-2.0.1.jar:2.0.1]
at org.skife.jdbi.v2.SQLStatement.internalExecute(SQLStatement.java:1328) ~[jdbi-2.63.1.jar:2.63.1]
at org.skife.jdbi.v2.Update.execute(Update.java:56) ~[jdbi-2.63.1.jar:2.63.1]
at io.druid.metadata.IndexerSQLMetadataStorageCoordinator.insertToMetastore(IndexerSQLMetadataStorageCoordinator.java:662) ~[druid-server-0.12.3-iap6.jar:0.12.3-iap6]
at io.druid.metadata.IndexerSQLMetadataStorageCoordinator.allocatePendingSegment(IndexerSQLMetadataStorageCoordinator.java:547) ~[druid-server-0.12.3-iap6.jar:0.12.3-iap6]
at io.druid.metadata.IndexerSQLMetadataStorageCoordinator.access$200(IndexerSQLMetadataStorageCoordinator.java:80) ~[druid-server-0.12.3-iap6.jar:0.12.3-iap6]
at io.druid.metadata.IndexerSQLMetadataStorageCoordinator$3.inTransaction(IndexerSQLMetadataStorageCoordinator.java:404) ~[druid-server-0.12.3-iap6.jar:0.12.3-iap6]
at io.druid.metadata.IndexerSQLMetadataStorageCoordinator$3.inTransaction(IndexerSQLMetadataStorageCoordinator.java:399) ~[druid-server-0.12.3-iap6.jar:0.12.3-iap6]
at org.skife.jdbi.v2.tweak.transactions.LocalTransactionHandler.inTransaction(LocalTransactionHandler.java:184) ~[jdbi-2.63.1.jar:2.63.1]
at org.skife.jdbi.v2.BasicHandle.inTransaction(BasicHandle.java:327) ~[jdbi-2.63.1.jar:2.63.1]
at org.skife.jdbi.v2.DBI$5.withHandle(DBI.java:333) ~[jdbi-2.63.1.jar:2.63.1]
at org.skife.jdbi.v2.DBI.withHandle(DBI.java:281) ~[jdbi-2.63.1.jar:2.63.1]
... 80 more

解决

 通过 duplicate key value violates unique constraint "druid_pendingsegments_pkey" 日志,我们可以看出是因为多个线程同时尝试分配一个 Segment 文件导致的问题。这种报错 Druid 通常可以通过重试自动解决,不需要手动处理。但是,如果这种报错频繁出现,那么说明 Segment 分配的时间过长,冲突的可能性过大了。目前,Druid 已经针对 druid_segments 表的 dataSourceusedendstart 字段增加了索引,提高元数据检索性能。

1
druid=> \d+ druid_segments
1
2
3
4
5
6
7
8
9
10
11
12
13
14
15
16
                                         Table "public.druid_segments"
Column | Type | Collation | Nullable | Default | Storage | Stats target | Description
--------------+------------------------+-----------+----------+---------+----------+--------------+-------------
id | character varying(255) | | not null | | extended | |
datasource | character varying(255) | | not null | | extended | |
created_date | character varying(255) | | not null | | extended | |
start | character varying(255) | | not null | | extended | |
end | character varying(255) | | not null | | extended | |
partitioned | boolean | | not null | | plain | |
version | character varying(255) | | not null | | extended | |
used | boolean | | not null | | plain | |
payload | bytea | | not null | | extended | |
Indexes:
"druid_segments_pkey" PRIMARY KEY, btree (id)
"idx_druid_segments_datasource_used_end" btree (datasource, used, "end", start)
"idx_druid_segments_used" btree (used)

 同样,通过开启 druid.coordinator.kill.pendingSegments.on 参数可以自动清理 pending 状态的 Segment 文件(默认是开启的),触发清理的时间由 druid.coordinator.kill.period 参数指定(默认是 P1D)。

写入任务运行失败,报错 No space left on device

描述

 排除极端情况下,因为 MM 重启导致的临时文件没有及时删除

1
$ cd ~/var/tmp/ && ls -sail -tr | head -10
1
2
3
4
5
6
7
8
9
10
total 10276
36385368 4 drwxrwxr-x 4 druid druid 4096 Dec 21 20:43 ..
36385053 4 drwx------ 2 druid druid 4096 Dec 21 20:43 druid-realtime-persist687212640828492794
36385054 4 drwx------ 2 druid druid 4096 Dec 21 20:43 druid-realtime-persist58317306395372829
36385055 4 drwx------ 2 druid druid 4096 Dec 21 20:55 druid-realtime-persist6843970825363436477
36385056 4 drwx------ 2 druid druid 4096 Dec 21 20:59 druid-realtime-persist1302620819891814444
36385058 4 drwx------ 2 druid druid 4096 Dec 21 21:02 druid-realtime-persist6271874691820670095
36385066 4 drwx------ 2 druid druid 4096 Dec 21 22:33 druid-realtime-persist6902402545709078287
36385074 4 drwx------ 2 druid druid 4096 Dec 21 22:38 druid-realtime-persist5560912746108288407
36385079 4 drwx------ 2 druid druid 4096 Dec 21 22:39 druid-realtime-persist2576389476177086182
1
$ cd ~/var/druid/task/ && ls -sail -tr
1
2
3
4
5
6
7
8
9
10
11
12
total 52
2 4 drwxrwsr-x 8 root druid 4096 Jan 17 2022 ..
5767169 4 drwxrwsr-x 3 druid druid 4096 Feb 22 2023 coordinator-issued_kill_yuzhouwan_kcmbobpl_2022-09-01T00:00:00.000Z_2022-10-01T00:00:00.000Z_2023-02-22T09:31:14.272Z
2359489 4 drwxr-sr-x 4 druid druid 4096 Dec 21 20:37 single_phase_sub_task_yuzhouwan_odonbcbo_2023-12-21T20:37:00.017Z
2359483 4 drwxr-sr-x 3 druid druid 4096 Dec 21 20:39 index_parallel_yuzhouwan_hpgdfohg_2023-12-21T20:38:37.710Z
2490923 4 drwxr-sr-x 4 druid druid 4096 Dec 21 20:39 single_phase_sub_task_yuzhouwan_jjppegod_2023-12-21T20:39:09.996Z
2621470 4 drwxr-sr-x 4 druid druid 4096 Dec 21 20:41 single_phase_sub_task_yuzhouwan_kpijhhif_2023-12-21T20:40:50.187Z
1310723 4 drwxrwsr-x 2 druid druid 4096 Jan 10 03:27 assignedTasks
1310722 4 drwxrwsr-x 2 druid druid 4096 Jan 10 03:27 workerTaskManagerTmp
1310728 4 -rw-rw-r-- 1 druid druid 19 Jan 10 03:27 restore.json
1310721 4 drwxrwsr-x 10 druid druid 4096 Jan 10 03:27 .
1310724 12 drwxrwsr-x 2 druid druid 12288 Jan 10 03:29 completedTasks

解决

 如果排除了 MM 在极端情况下,因为重启导致临时文件没有及时删除的原因,那么,可能是因为业务自然增长导致的 MM 磁盘资源不足,使用更大的磁盘即可

查询性能不高

描述

 资源的负载并不高,但是查询延迟却很大

解决

 有一种可能,是查询的并发度被设置得太低导致的,检查并适当调高 Broker 和 Historical 的 druid.server.http.numThreads,以及 MiddleMananger 的 druid.indexer.fork.property.druid.processing.numThreads 参数

社区发展

版本迭代

---
title: New features on recent major versions of Apache Druid
---

gitGraph:

checkout main

%% 0.16.0
branch v16 order: 16
checkout v16

commit id: "..." type: NORMAL

checkout main
commit id: " "
merge v16

%% 0.17.0
branch v17 order: 17
checkout v17

commit id: "Fast historical start with lazy loading" type: HIGHLIGHT

checkout main
merge v17

%% 0.18.0
branch v18 order: 18
checkout v18

commit id: "Join (INNER, LEFT, and CROSS)" type: HIGHLIGHT
commit id: "Roaring bitmaps as default" type: NORMAL

checkout main
merge v18

%% 0.19.0
branch v19 order: 19
checkout v19

commit id: "GroupBy and Timeseries vectorized query engines enabled by default" type: NORMAL

checkout main
merge v19

%% 0.20.0
branch v20 order: 20
checkout v20

commit id: "Vectorization" type: HIGHLIGHT

checkout main
merge v20

%% 0.21.0
branch v21 order: 21
checkout v21

commit id: "Service discovery and leader election based on K8s" type: NORMAL

checkout main
merge v21

%% 0.22.0
branch v22 order: 22
checkout v22

commit id: "Using deep storage for intermediary shuffle data" type: NORMAL

checkout main
merge v22

%% 0.23.0
branch v23 order: 23
checkout v23

commit id: "Multi-dimension range partitioning" type: HIGHLIGHT
commit id: "Grouping on arrays without exploding the arrays" type: NORMAL

checkout main
merge v23

%% 24.0.0
branch v24 order: 24
checkout v24

commit id: "Multi-stage query task engine" type: HIGHLIGHT tag: "experimental"
commit id: "Vectorized many aggregators" type: NORMAL

checkout main
merge v24

%% 25.0.0
branch v25 order: 25
checkout v25

commit id: "Kubernetes-native tasks" type: HIGHLIGHT
commit id: "Multi-stage query (MSQ) task engine" type: HIGHLIGHT
commit id: "Async reads for JDBC" type: NORMAL

checkout main
merge v25

%% 26.0.0
branch v26 order: 26
checkout v26

commit id: "Auto type column schema" type: HIGHLIGHT tag: "experimental"
commit id: "Sort-merge join and hash shuffle join" type: HIGHLIGHT
commit id: "UNNEST arrays" type: HIGHLIGHT tag: "experimental"
commit id: "Support EXTEND in SQL syntax" type: NORMAL

checkout main
merge v26

%% 27.0.0
branch v27 order: 27
checkout v27

commit id: "Query from deep storage" type: HIGHLIGHT tag: "experimental"
commit id: "Schema auto-discovery and array column types" type: HIGHLIGHT
commit id: "New Explore view UI" type: HIGHLIGHT tag: "experimental"
commit id: "Smart segment loading" type: HIGHLIGHT
commit id: "Java 17 support" type: NORMAL
commit id: "Hadoop 2 deprecated" type: REVERSE

checkout main
merge v27

%% 28.0.0
branch v28 order: 28
checkout v28

commit id: "Trash Bin" type: HIGHLIGHT
commit id: "Ingest from multiple Kafka topics" type: NORMAL
commit id: "Async query and query from deep storage" type: NORMAL

checkout main
merge v28

%% 29.0.0
branch v29 order: 29
checkout v29

commit id: "DDSketch" type: HIGHLIGHT
commit id: "Audit Log" type: HIGHLIGHT

checkout main
merge v29

Star 趋势

TSDB Star History

(图片来源:star-history.t9t.io™ 官网)

个人贡献

 详见:《如何成为 Apache 的 PMC

资料

Doc

SQL type Druid runtime type Default value Notes
CHAR STRING ''
VARCHAR STRING '' Druid STRING columns are reported as VARCHAR. Can include multi-value strings as well.
DECIMAL DOUBLE 0.0 DECIMAL uses floating point, not fixed point math
FLOAT FLOAT 0.0 Druid FLOAT columns are reported as FLOAT
REAL DOUBLE 0.0
DOUBLE DOUBLE 0.0 Druid DOUBLE columns are reported as DOUBLE
BOOLEAN LONG false
TINYINT LONG 0
SMALLINT LONG 0
INTEGER LONG 0
BIGINT LONG 0 Druid LONG columns (except __time) are reported as BIGINT
TIMESTAMP LONG 0, meaning 1970-01-01 00:00:00 UTC Druid’s __time column is reported as TIMESTAMP. Casts between string and timestamp types assume standard SQL formatting, such as 2000-01-02 03:04:05, not ISO 8601 formatting. For handling other formats, use one of the time functions.
DATE LONG 0, meaning 1970-01-01 Casting TIMESTAMP to DATE rounds down the timestamp to the nearest day. Casts between string and date types assume standard SQL formatting—for example, 2000-01-02. For handling other formats, use one of the time functions.
ARRAY ARRAY NULL Druid native array types work as SQL arrays, and multi-value strings can be converted to arrays. See Arrays for more information.
OTHER COMPLEX none May represent various Druid column types such as hyperUnique, approxHistogram, etc.
可以通过调整 druid.indexing.doubleStorage 配置项,来控制浮点型数据存储为 float 还是 double,默认值为 double

Github

Book

  • Druid 实时大数据分析原理与实践
  • 大数据系统构建:可扩展实时数据系统构建原理

欢迎加入我们的技术群,一起交流学习

群名称 群号
人工智能(高级)
人工智能(进阶)
大数据
算法
数据库
Apache Druid 钉钉群 23318065